This admin procedure will provide background information on the necessary Auditing processes that need to take place within each section of the Azure environment.
This article is intended for employees of organizations that use Sittadel's security. Additionally, there are some actions that can only be accomplished by those with administrative privileges.
Procedure Scope: Administrators
Required Group Membership: Admin.Compliance
Azure Active Directory
- We will start off with a list of important Active Directory logs that should be checked:
- Navigate to Sign-In Logs – Azure Active Directory and Audit Logs – Azure Active Directory, these will house all of the events listed below.
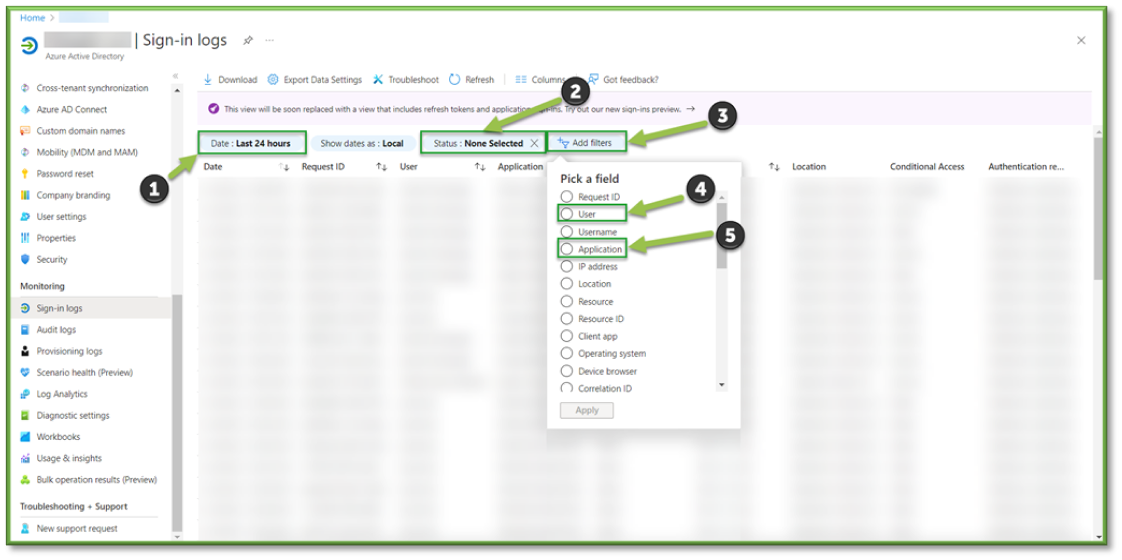
- In Sign-In Logs, all authentication attempts made within the last 24 hours will be displayed. Important filters can be applied and modified to aid in troubleshooting efforts or establish a chain of custody for specific users.
- The Date Filter can be modified to look back as far as a 30-day span, with the ability to select a custom date that falls within that timeframe. This can be important in determining account inactivity or seeing if a user had tried to access a resource.
- The Status Filter can be modified to search for specifically successful or failed login attempts. This can be useful in the case of failed attempts to determine login troubleshooting, or compromised account access attempts. Successful attempt cases can be useful for determining resource accessing that shouldn’t have been made.
- The User Filter can be selected to aid in weeding out unnecessary audits of accounts that are outside of the scope of your search.
- The Application Filter can be selected to aid in searching for specific application interfacing such as Azure Portals, O365 Apps, etc. this can be useful for determining chain of custody for resource accessing or modifications.
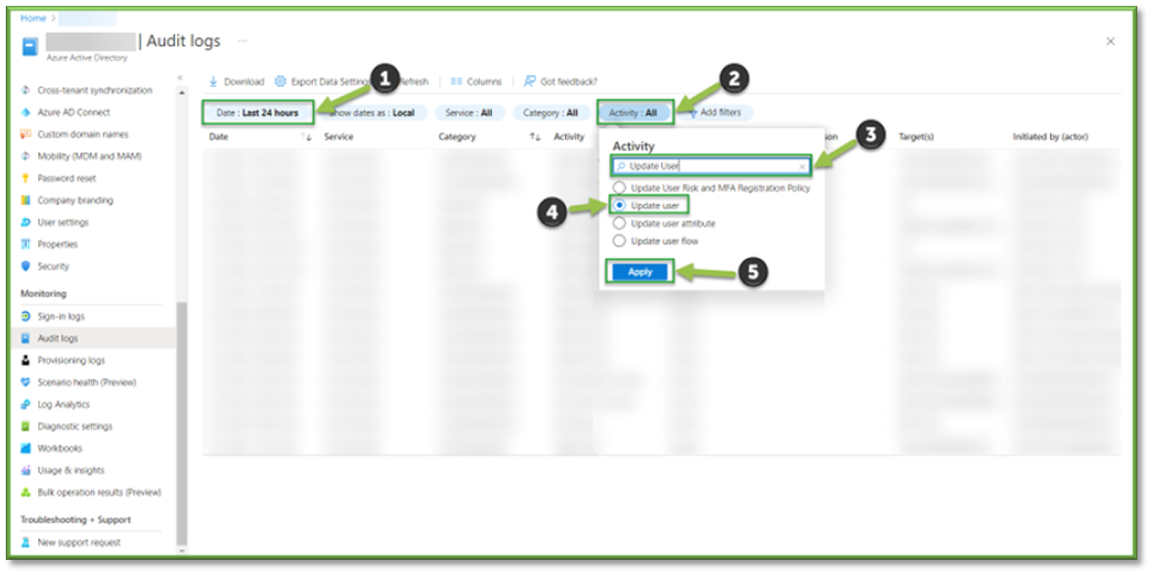
- In Audit Logs, all changes to the Azure Active Directory Tenant within the last 24 hours will be listed. Important filters can be applied and modified to aid in troubleshooting efforts or establish a chain of custody for specific users.
- The Date Filter can be modified to look back as far as a 30-day span, with the ability to select a custom date that falls within that timeframe. This can be important in determining account inactivity or seeing if a user had tried to access a resource.
- The Activity Filter can be modified to look for specific events, using the search bar look for the Update User event.
- The Update User Filter will list all the events associated with updating a property of a user account, an example would be updating the MFA token associated with an account session.
- In Audit Logs, all changes to the Azure Active Directory Tenant within the last 24 hours will be listed. Important filters can be applied and modified to aid in troubleshooting efforts or establish a chain of custody for specific users.
- The Date Filter can be modified to look back as far as a 30-day span, with the ability to select a custom date that falls within that timeframe. This can be important in determining account inactivity or seeing if a user had tried to access a resource.
- The Activity Filter can be modified to look for specific events, using the search bar look for the Update Role event.
- The Update Role Filter will list all events that show any modification of a role assignment to a user or group inside of the tenant.

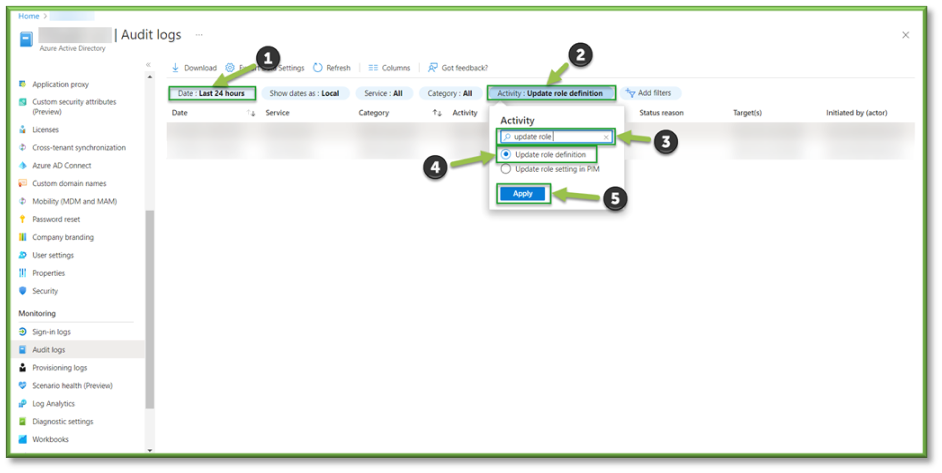
- The Activity Filter can be modified to look for specific events, using the search bar look for the Update Role Definition event.
- The Update Role Definition Filter will list all events that show any modification of an existing roles permission assignment.
- In Audit Logs, all changes to the Azure Active Directory Tenant within the last 24 hours will be listed. Important filters can be applied and modified to aid in troubleshooting efforts or establish a chain of custody for specific users.
- The Date Filter can be modified to look back as far as a 30-day span, with the ability to select a custom date that falls within that timeframe. This can be important in determining account inactivity or seeing if a user had tried to access a resource.
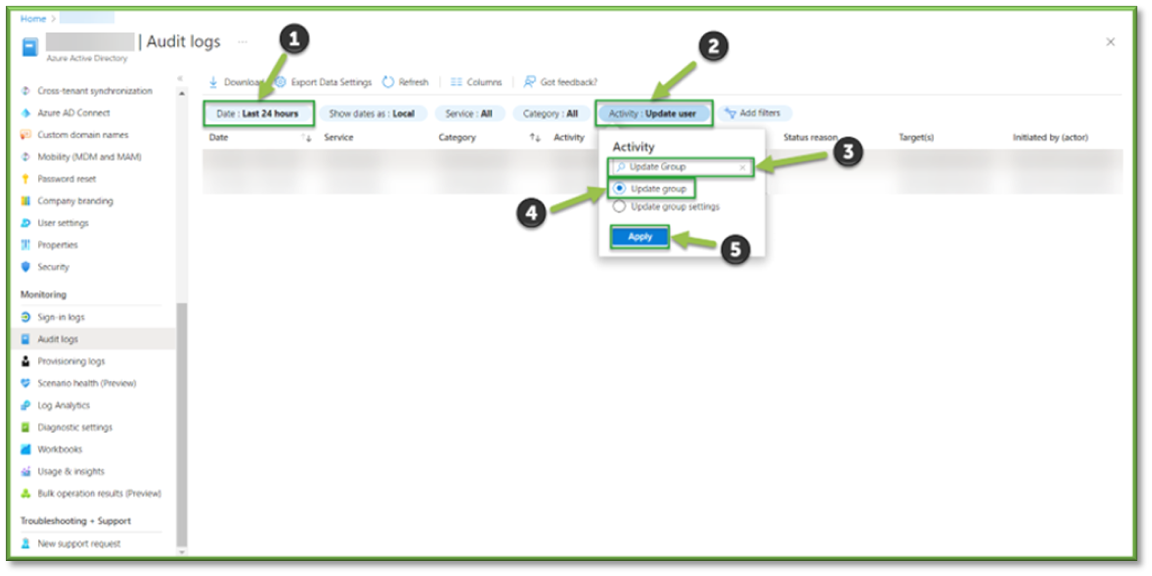
- The Activity Filter can be modified to look for specific events, using the search bar look for the Update Group event.
- The Update Group Filter will list all events that show any modification of a group membership assignment or role adjustments.
- In Audit Logs, all changes to the Azure Active Directory Tenant within the last 24 hours will be listed. Important filters can be applied and modified to aid in troubleshooting efforts or establish a chain of custody for specific users.
- The Date Filter can be modified to look back as far as a 30-day span, with the ability to select a custom date that falls within that timeframe. This can be important in determining account inactivity or seeing if a user had tried to access a resource.
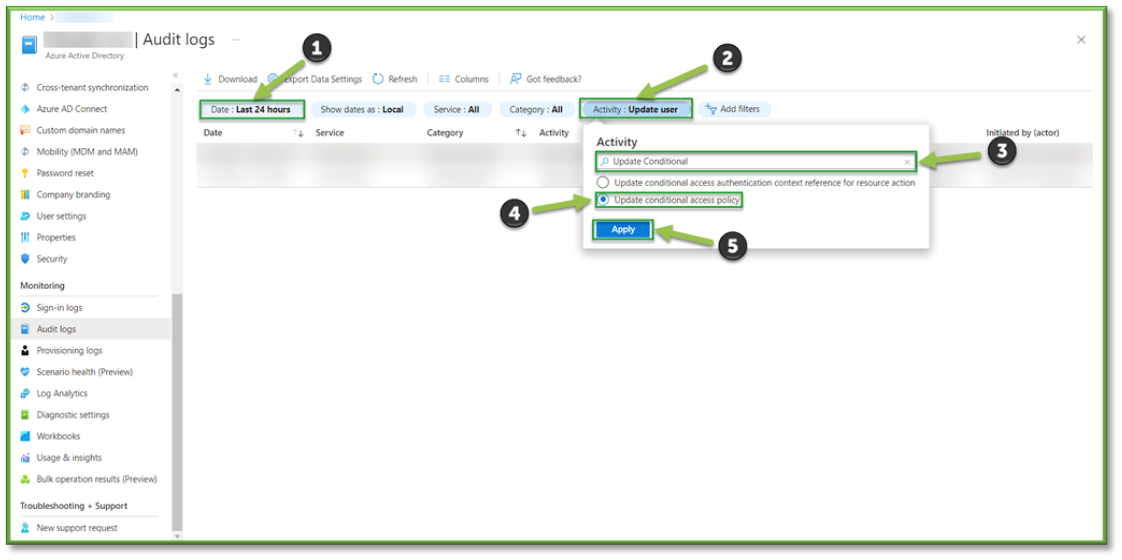
- The Activity Filter can be modified to look for specific events, using the search bar look for the Update Conditional Access Policy event.
- The Update Conditional Access Policy Filter will list all events that show any modification of a conditional access policy.
- In Audit Logs, all changes to the Azure Active Directory Tenant within the last 24 hours will be listed. Important filters can be applied and modified to aid in troubleshooting efforts or establish a chain of custody for specific users.
- The Date Filter can be modified to look back as far as a 30-day span, with the ability to select a custom date that falls within that timeframe. This can be important in determining account inactivity or seeing if a user had tried to access a resource.
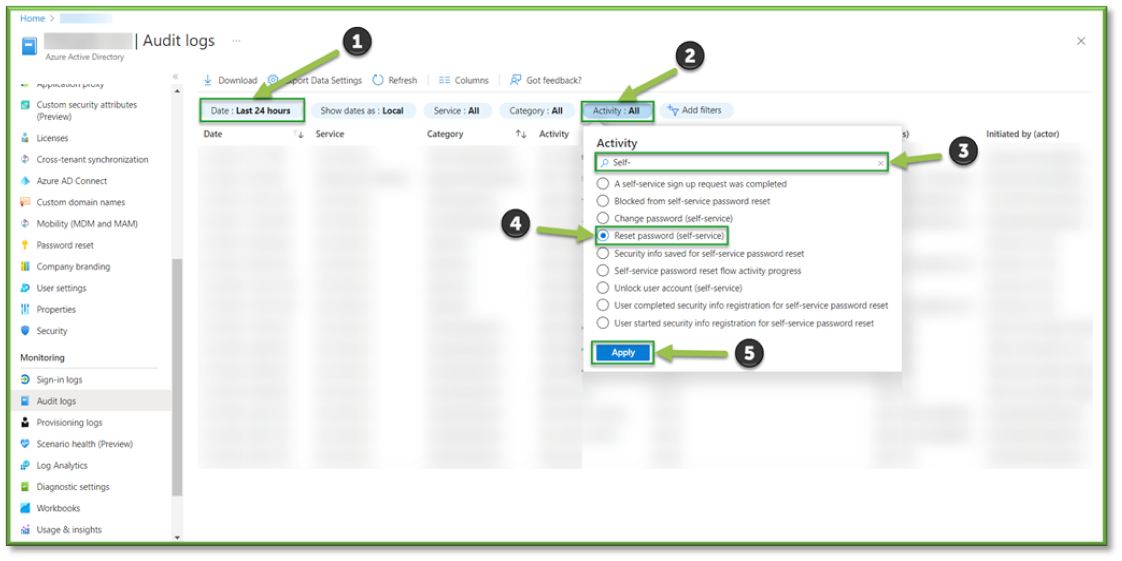
- The Activity Filter can be modified to look for specific events, using the search bar look for the Reset Password (Self-Service) event.
- The Reset Password (Self-Service) Filter will list all events of a registered user applying for and completing a self-service password service.
- In Audit Logs, all changes to the Azure Active Directory Tenant within the last 24 hours will be listed. Important filters can be applied and modified to aid in troubleshooting efforts or establish a chain of custody for specific users.
- The Date Filter can be modified to look back as far as a 30-day span, with the ability to select a custom date that falls within that timeframe. This can be important in determining account inactivity or seeing if a user had tried to access a resource.
- The Activity Filter can be modified to look for specific events, using the search bar look for the Update the Company Default Cross-Tenant Access Settings event.
- The Update Cross-Tenant Access Filter will list all events that show an adjustment of either allowing or blocking collaboration types inbound or outbound of your organization.

Microsoft Intune
- Next, we will look at a list of important Intune logs that should be checked:
- Navigate to Monitor Device Actions – Intune, Audit Logs – Intune, and Device Compliance Status Report – Intune these will house all of the events listed below.
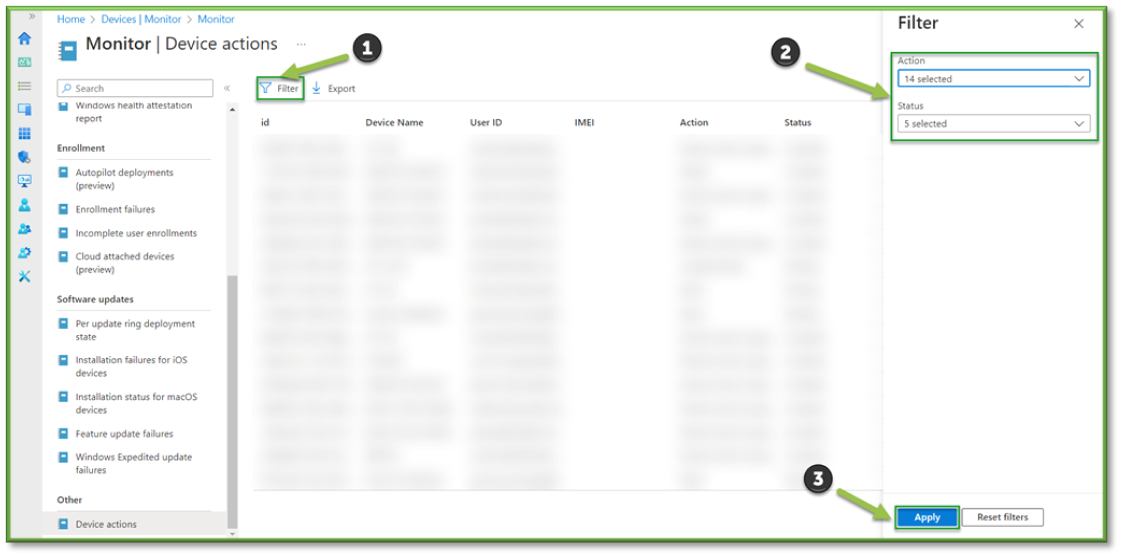
- In Device Actions, all the actions taken on a device will be listed, this includes wipes, retiring, password resets, remote lock, etc. Additionally, the status of the action for the device will be listed, such as complete, pending, failed, etc. as well as the administrator that initiated the actions.
- You can specify the types of actions or statuses of an action by using the Filter button, this could be useful in tracking actions carried out on a user device for possible malicious or invasive activities.
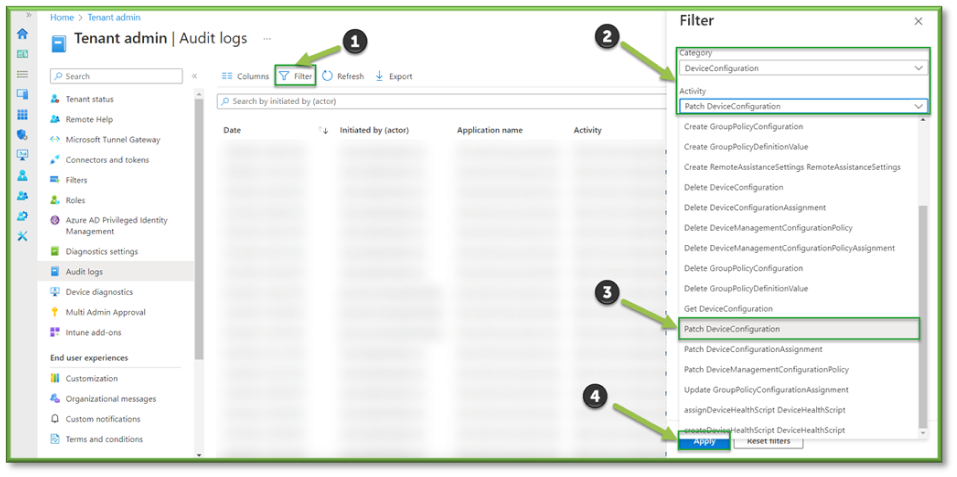
- ln Audit Logs, select Filter. Under Category select DeviceConfiguration. Under Activity locate Patch DeviceConfiguration. You will need to specify a time range that fits the requirements of your search. When all the filters are applied, a list of all configuration profile modifications will be generated.
- The Filter will list important details such as the administrator that initiated the modification process and the configuration profile that was targeted for modification; these values will be important in determining chain of custody and which values were updated.
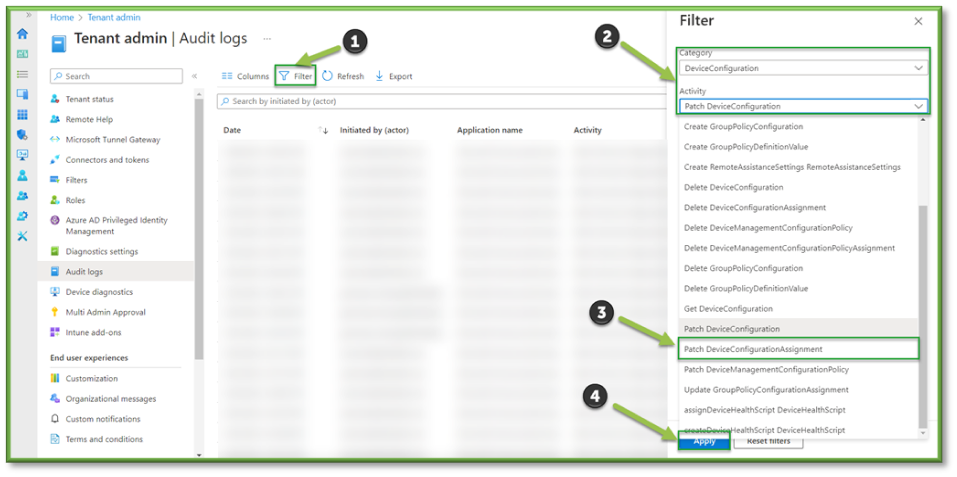
- ln Audit Logs, select Filter. Under Category select DeviceConfiguration. Under Activity locate Patch DeviceConfiguration Assignment. You will need to specify a time range that fits the requirements of your search. When all the filters are applied, a list of all configuration profile assignment additions or removal will be generated.
- The Filter will list important details such as the administrator that initiated the modification process and the configuration profile that was targeted for modification; these values will be important in determining chain of custody and the new scope of users being impacted by the profile.
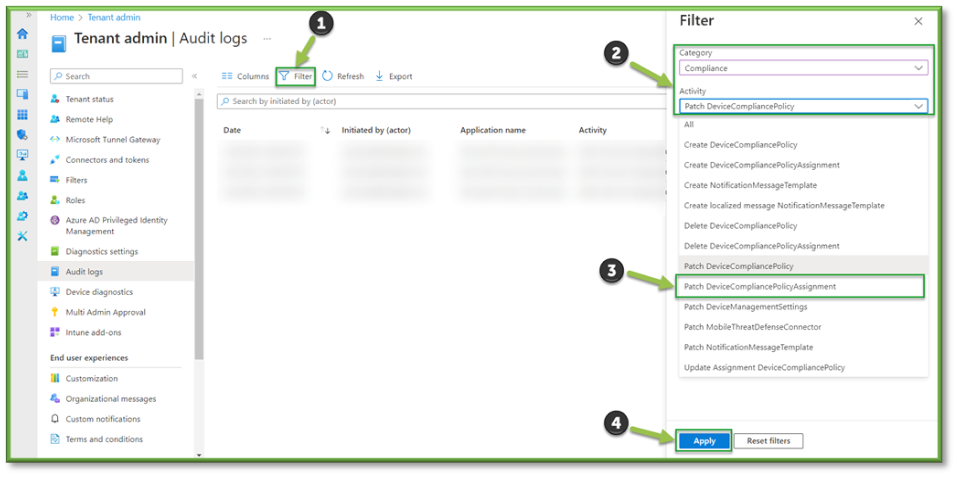
- ln Audit Logs, select Filter. Under Category select Compliance. Under Activity locate Patch DeviceCompliancePolicy. You will need to specify a time range that fits the requirements of your search. When all the filters are applied, a list of all compliance policy modifications will be generated.
- The Filter will list important details such as the administrator that initiated the modification process and the configuration profile that was targeted for modification; these values will be important in determining chain of custody and which values were updated.

- ln Audit Logs, select Filter. Under Category select DeviceConfiguration. Under Activity locate Patch DeviceCompliancePolicy Assignment. You will need to specify a time range that fits the requirements of your search. When all the filters are applied, a list of all compliance policy assignment additions or removal will be generated.
- The Filter will list important details such as the administrator that initiated the modification process and the compliance policy that was targeted for modification; these values will be important in determining chain of custody and the new scope of users being impacted by the profile.
- ln the Device Compliance Status Report a list of all the registered onboarded devices will be listed; aside from device details you will see the listed compliance status of each device, this will vary between either the device being compliant with organizational policy or non-complaint.
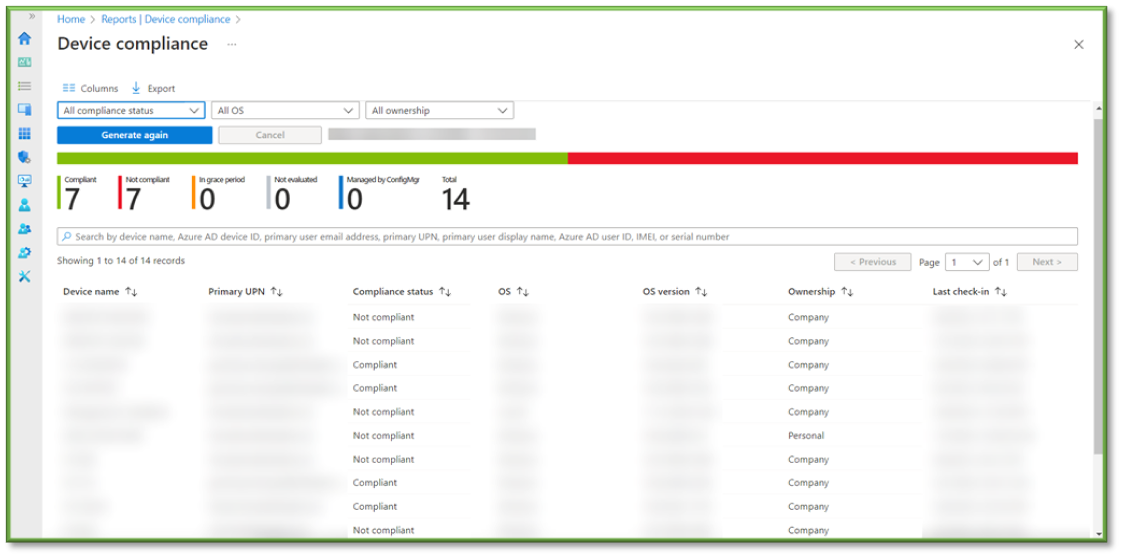
- You can export this data and do additionally hunting to alleviate these non-compliant devices, in order to do this, you will need redirect to Noncompliant Devices – Intune. This will list all the non-compliant devices in your organization.

- When you click into one of the devices, locate the Device Compliance tab to see the specific policy that is failing for the device.

- When you select one of the policies, the individual setting configurations for the policy will be displayed along with if they have been successfully deployed by the device, you can construct a list for troubleshooting the device to get it in line with compliance or take into account the risk for the device and make it an exception in policy which should be a last ditch effort if all other options have been exhausted.

Application update events.
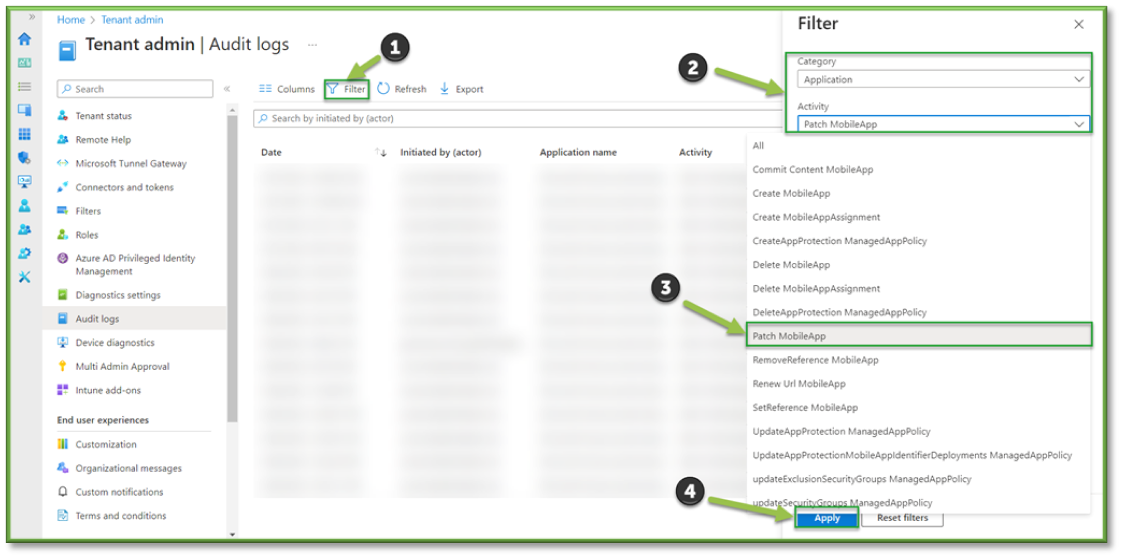
- ln Audit Logs, select Filter. Under Category select Application. Under Activity locate Patch MobileApp. You will need to specify a time range that fits the requirements of your search. When all the filters are applied, a list of all mobile app modifications will be generated.
- The Filter will list important details such as the administrator that initiated the modification process and the application that was targeted for modification; these values will be important in determining chain of custody and which values were updated.
- ln Audit Logs, select Filter. Under Category select Application. Under Activity locate Patch MobileApp. You will need to specify a time range that fits the requirements of your search. When all the filters are applied, a list of all app protection policy modifications will be generated.
- The Filter will list important details such as the administrator that initiated the modification process and the app protection policy that was targeted for modification; these values will be important in determining chain of custody and which values were updated.

Microsoft Purview
- Then, we will look at a list of important Purview logs that should be checked:
- Navigate to Auditing – Purview, this will house all the events listed below.
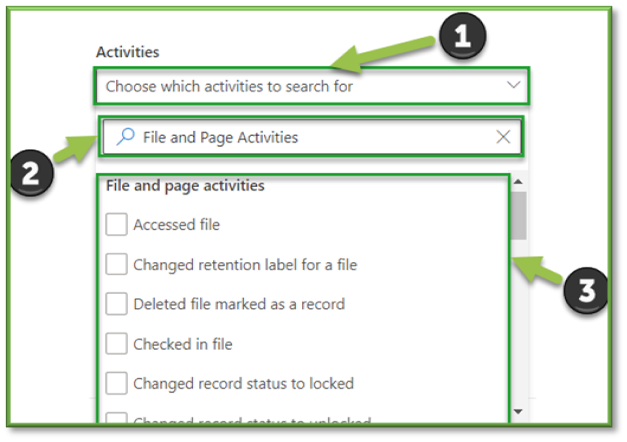
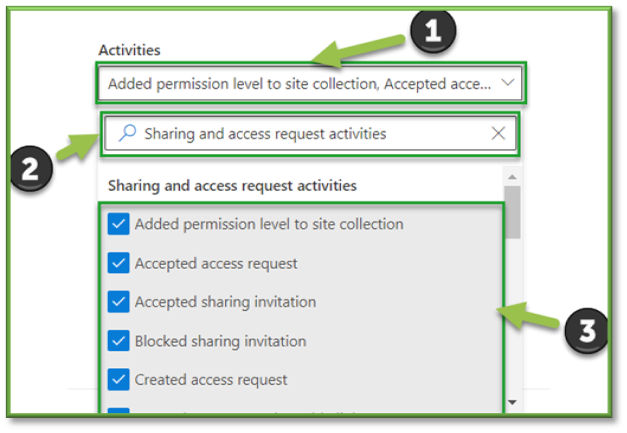
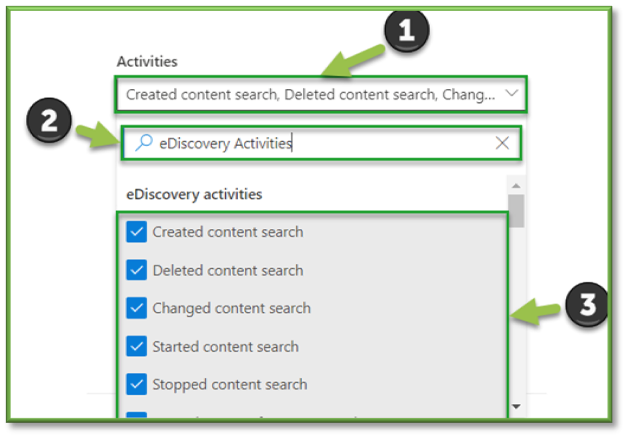
- In Auditing select the Activities Filter, this will list all the possible activities that can be monitored through Purview, most of these events will revolve around SharePoint, OneDrive, Planner, Teams, and Outlook activities with a heavy focus on data transaction tracking.
- For the sake of file events that can be monitored through SharePoint the following sections will be listed that will encompass the modification of SharePoint files. You can use the search box to highlight these sections for easier configuration.
- File and Page Activities; all settings.
- Sharing and Access Request Activities; Shared file, folder, or site, Unshared file, folder, or site.
- Synchronization Activities; all settings.
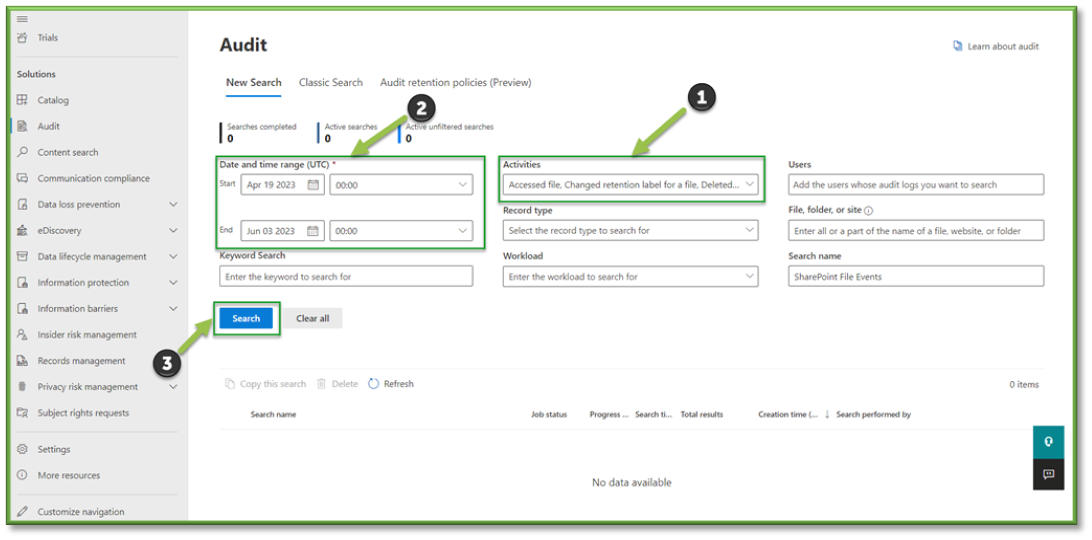
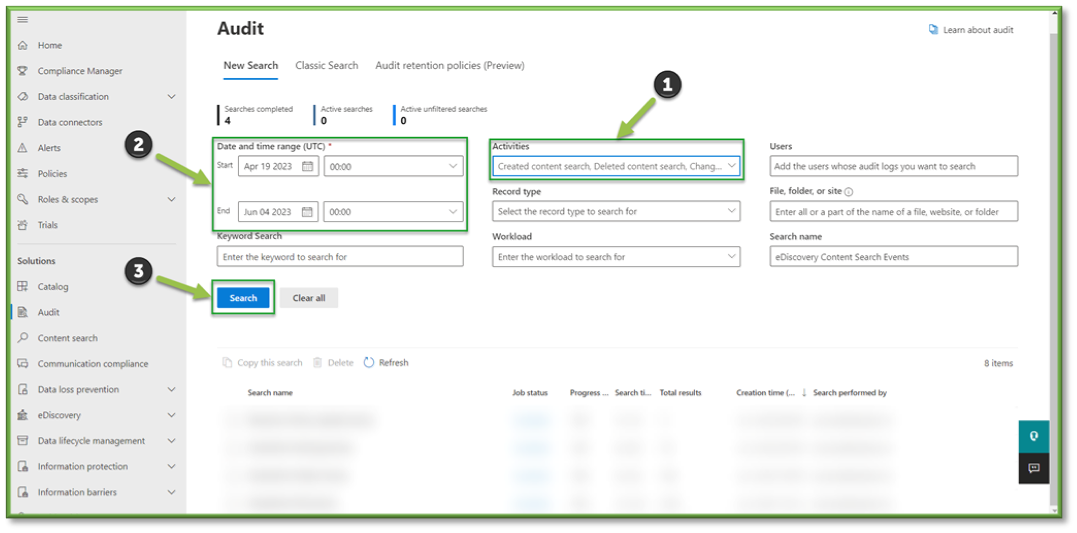
- Once all the settings are configured, you will also need to supply the search with a Date and Time Range; this search can go back as far as 90 days. Once all the prerequisites are filled, select Search to start the pulling of all the logs from the Purview log database.
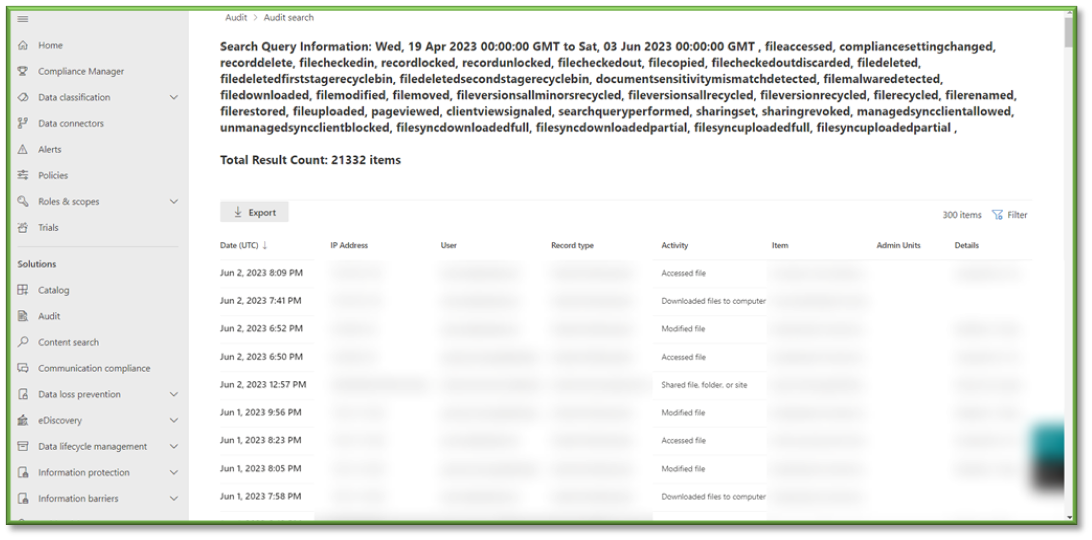
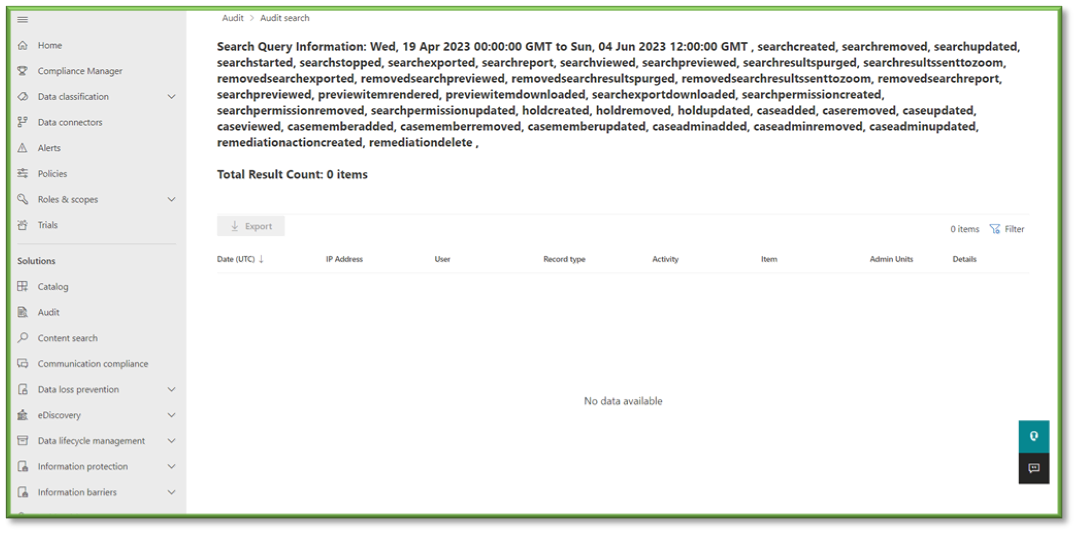
- You will have to wait some time for the queue search to be completed, once it is successfully completed you can select the results. All the events that have taken place between the timeframe specified will be displayed, they will be listed based in descending order of date showing the user that initiated the event, the activity type, the name of the file they accessed and any additional details such as the directory that the file existed in.
- In Auditing select the Activities Filter, this will list all the possible activities that can be monitored through Purview, most of these events will revolve around SharePoint, OneDrive, Planner, Teams, and Outlook activities with a heavy focus on data transaction tracking.
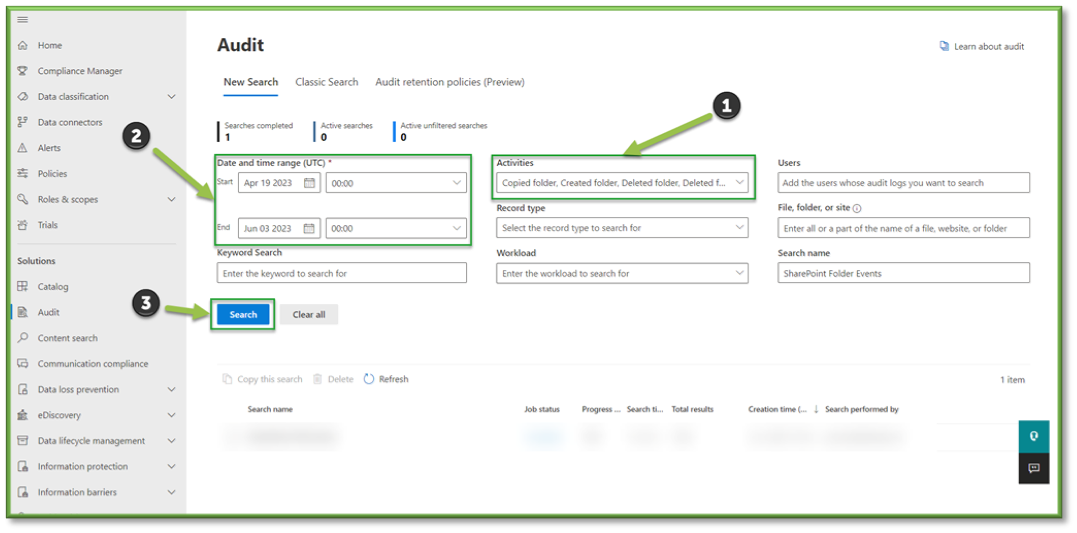
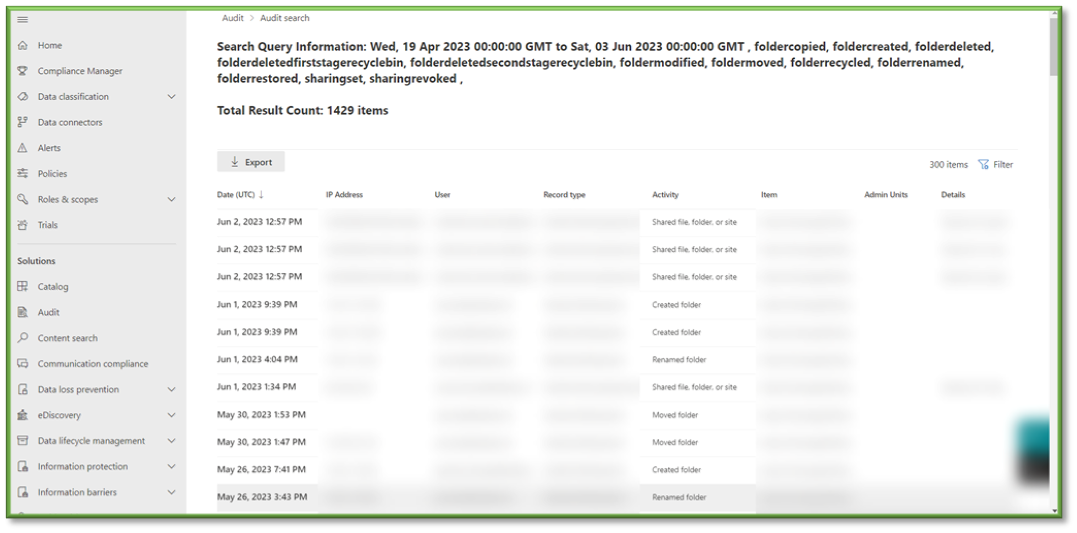
- For the sake of folder events that can be monitored through SharePoint the following sections will be listed that will encompass the modification of SharePoint folders. You can use the search box to highlight these sections for easier configuration.
- Folder Activities; all settings.
- Sharing and Access Request Activities; Shared file, folder, or site, Unshared file, folder, or site.

- Once all the settings are configured, you will also need to supply the search with a Date and Time Range; this search can go back as far as 90 days. Once all the prerequisites are filled, select Search to start the pulling of all the logs from the Purview log database.
- You will have to wait some time for the queue search to be completed, once it is successfully completed you can select the results. All the events that have taken place between the timeframe specified will be displayed, they will be listed based in descending order of date showing the user that initiated the event, the activity type, the name of the file they accessed and any additional details such as the directory that the file existed in.
- In Auditing select the Activities Filter, this will list all the possible activities that can be monitored through Purview, most of these events will revolve around SharePoint, OneDrive, Planner, Teams, and Outlook activities with a heavy focus on data transaction tracking.
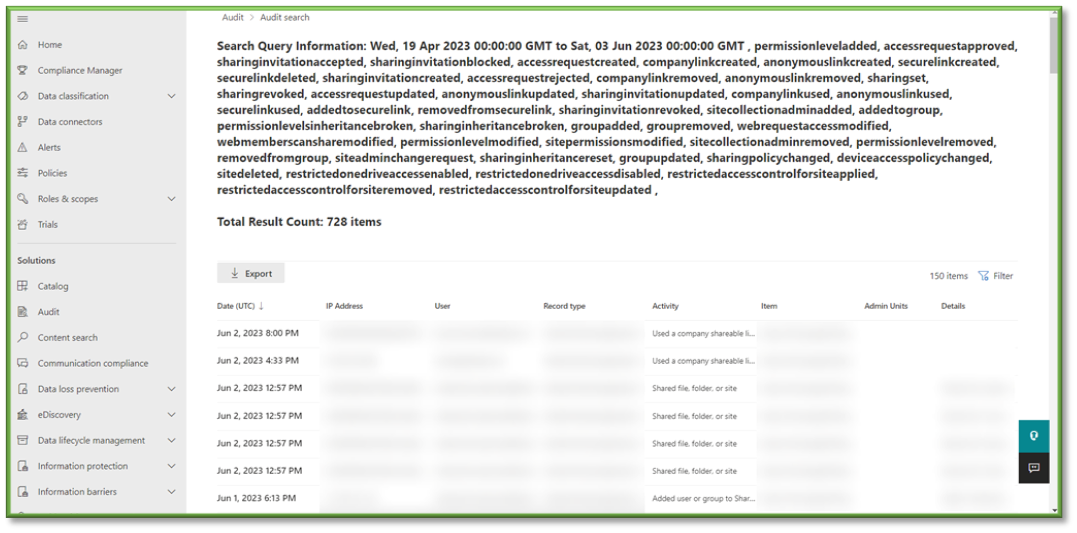
- For the sake of file events that can be monitored through SharePoint the following sections will be listed that will encompass the modification of SharePoint sharing. You can use the search box to highlight these sections for easier configuration.
- Sharing and Access Request Activities; all settings.
- Site Permission Activities; all settings.
- Site Administration Activities: Changed a Sharing Policy, Changed Device Access Policy, Deleted Site, Enabled Restricted OneDrive Access and Sharing, Disabled Restricted OneDrive Access and Sharing, Applied Restricted Access Control for Site, Removed Restricted Access Control for Site, Updated Restricted Access Control for Site.
- Once all the settings are configured, you will also need to supply the search with a Date and Time Range; this search can go back as far as 90 days. Once all the prerequisites are filled, select Search to start the pulling of all the logs from the Purview log database.

- You will have to wait some time for the queue search to be completed, once it is successfully completed you can select the results. All the events that have taken place between the timeframe specified will be displayed, they will be listed based in descending order of date showing the user that initiated the event, the activity type, the name of the file they accessed and any additional details such as the directory that the file existed in.
- In Auditing select the Activities Filter, this will list all the possible activities that can be monitored through Purview, most of these events will revolve around SharePoint, OneDrive, Planner, Teams, and Outlook activities with a heavy focus on data transaction tracking.
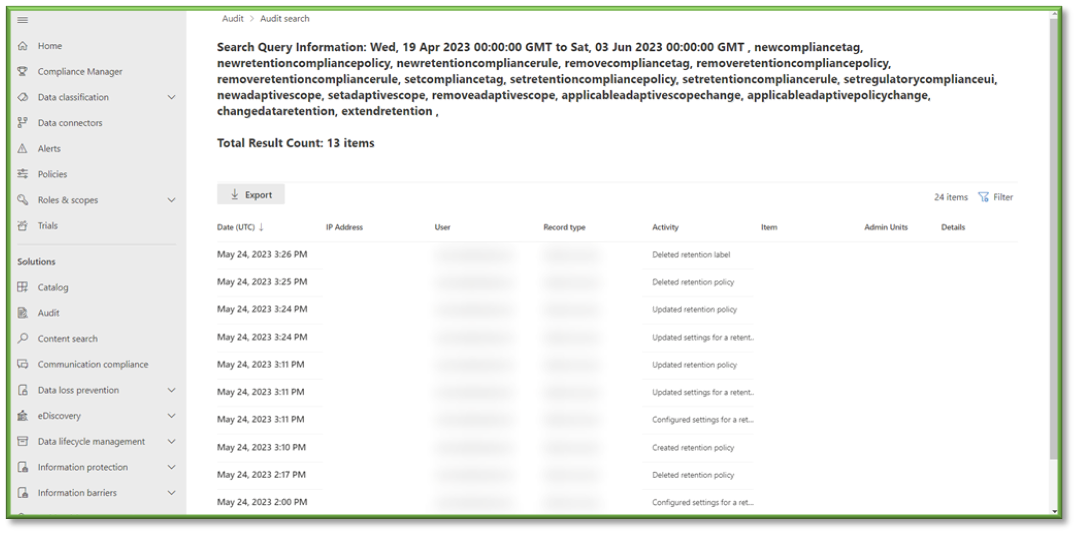
- For the sake of file events that can be monitored through SharePoint the following sections will be listed that will encompass the modification of Retention Policies and Labels. You can use the search box to highlight these sections for easier configuration.
- Retention Policy and Retention Label Activities; all settings.
- Microsoft Defender for Endpoint Settings Activities; all settings.
- Disposition Review Activities; all settings.

- Once all the settings are configured, you will also need to supply the search with a Date and Time Range; this search can go back as far as 90 days. Once all the prerequisites are filled, select Search to start the pulling of all the logs from the Purview log database.

- You will have to wait some time for the queue search to be completed, once it is successfully completed you can select the results. All the events that have taken place between the timeframe specified will be displayed, they will be listed based in descending order of date showing the user that initiated the event, the activity type, the name of the file they accessed and any additional details such as the directory that the file existed in.
- In Auditing select the Activities Filter, this will list all the possible activities that can be monitored through Purview, most of these events will revolve around SharePoint, OneDrive, Planner, Teams, and Outlook activities with a heavy focus on data transaction tracking.
- For the sake of file events that can be monitored through SharePoint the following sections will be listed that will encompass the creation of eDiscovery searches. You can use the search box to highlight these sections for easier configuration.
- eDiscovery Activities; all settings.
- eDiscovery Activities; all settings.
- Once all the settings are configured, you will also need to supply the search with a Date and Time Range; this search can go back as far as 90 days. Once all the prerequisites are filled, select Search to start the pulling of all the logs from the Purview log database.
- You will have to wait some time for the queue search to be completed, once it is successfully completed you can select the results. All the events that have taken place between the timeframe specified will be displayed, they will be listed based in descending order of date showing the user that initiated the event, the activity type, the name of the file they accessed and any additional details such as the directory that the file existed in.
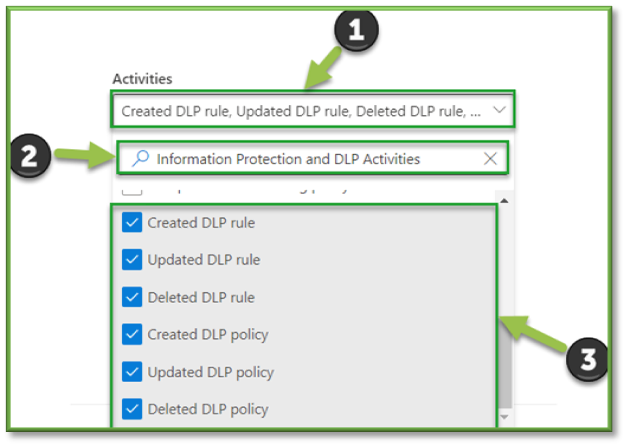
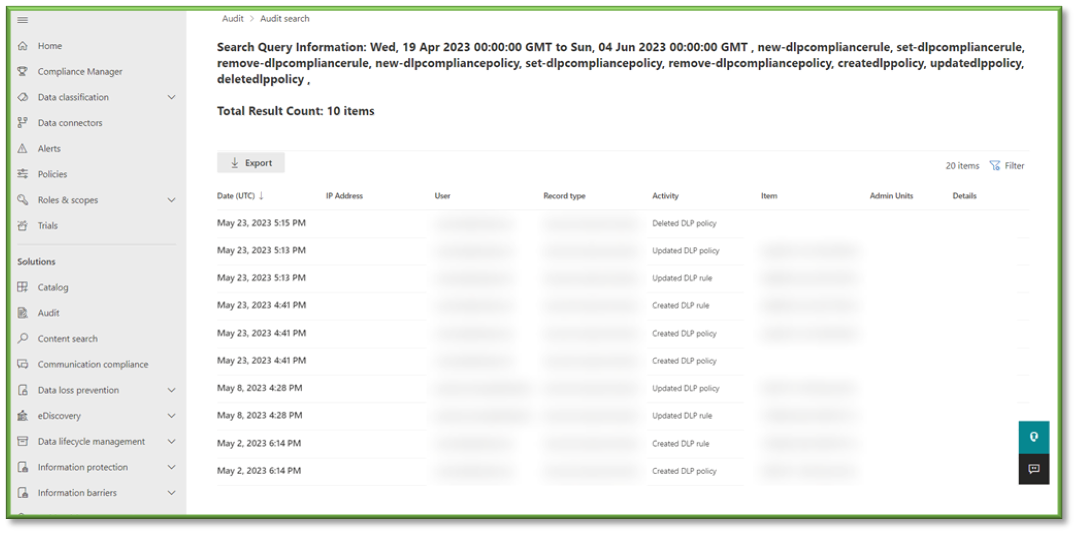
- In Auditing select the Activities Filter, this will list all the possible activities that can be monitored through Purview, most of these events will revolve around SharePoint, OneDrive, Planner, Teams, and Outlook activities with a heavy focus on data transaction tracking.
- For the sake of file events that can be monitored through SharePoint the following sections will be listed that will encompass the modification of DLP Policies and Rules. You can use the search box to highlight these sections for easier configuration.
- Information Protection and DLP Activities; Created DLP Rule, Updated DLP Rule, Deleted DLP Rule, Created DLP Policy, Updated DLP Policy, Deleted DLP Policy.
- Power Platform DLP Activities; all settings.
- Once all the settings are configured, you will also need to supply the search with a Date and Time Range; this search can go back as far as 90 days. Once all the prerequisites are filled, select Search to start the pulling of all the logs from the Purview log database.
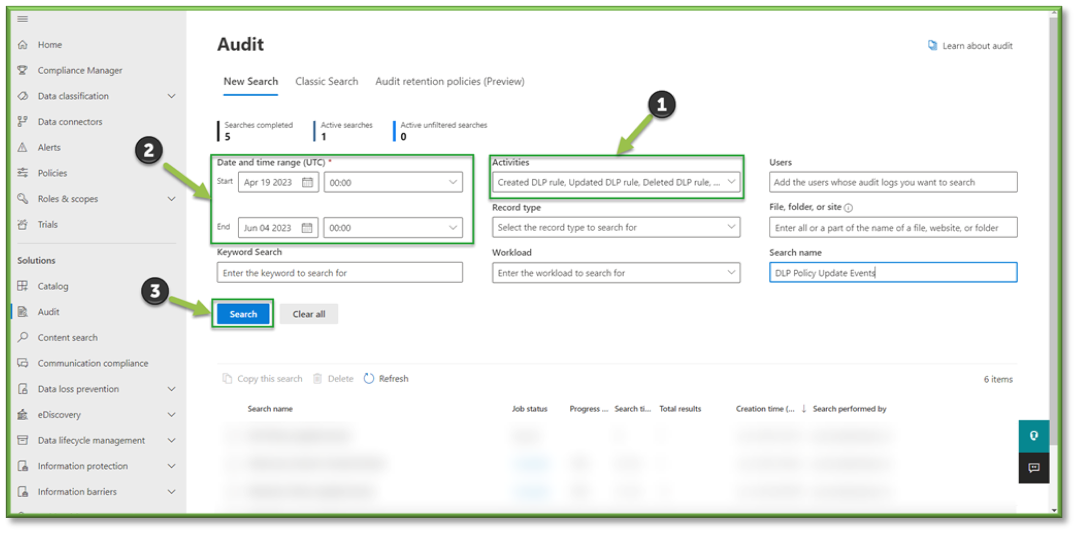
- You will have to wait some time for the queue search to be completed, once it is successfully completed you can select the results. All the events that have taken place between the timeframe specified will be displayed, they will be listed based in descending order of date showing the user that initiated the event, the activity type, the name of the file they accessed and any additional details such as the directory that the file existed in.
- In Auditing select the Activities Filter, this will list all the possible activities that can be monitored through Purview, most of these events will revolve around SharePoint, OneDrive, Planner, Teams, and Outlook activities with a heavy focus on data transaction tracking.
- For the sake of file events that can be monitored through SharePoint the following sections will be listed that will encompass the generating of alerts relating to DLP enforcement. You can use the search box to highlight these sections for easier configuration.
- Information Protection and DLP Activities; Matched DLP Rule, Removed DLP Rule from Document.

- Information Protection and DLP Activities; Matched DLP Rule, Removed DLP Rule from Document.
- Once all the settings are configured, you will also need to supply the search with a Date and Time Range; this search can go back as far as 90 days. Once all the prerequisites are filled, select Search to start the pulling of all the logs from the Purview log database.
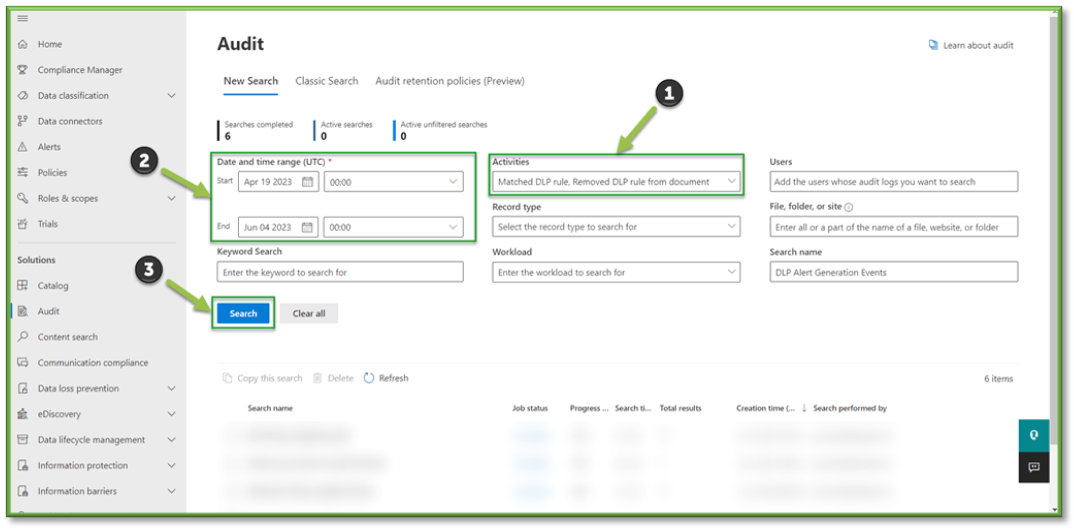
- You will have to wait some time for the queue search to be completed, once it is successfully completed you can select the results. All the events that have taken place between the timeframe specified will be displayed, they will be listed based in descending order of date showing the user that initiated the event, the activity type, the name of the file they accessed and any additional details such as the directory that the file existed in.

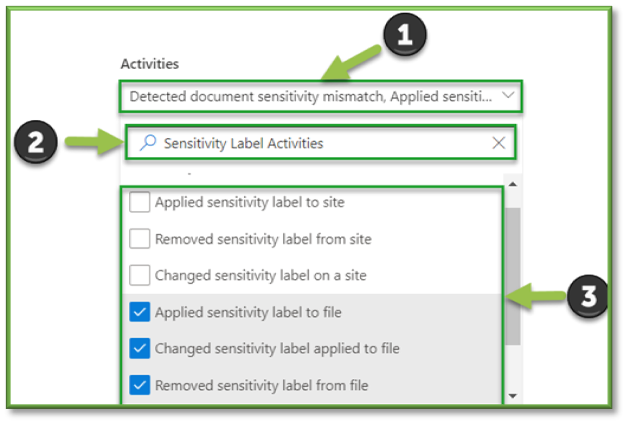
- In Auditing select the Activities Filter, this will list all the possible activities that can be monitored through Purview, most of these events will revolve around SharePoint, OneDrive, Planner, Teams, and Outlook activities with a heavy focus on data transaction tracking.
- For the sake of file events that can be monitored through SharePoint the following sections will be listed that will encompass the modification of Sensitivity Labels on files. You can use the search box to highlight these sections for easier configuration.
- File and Page Activities; all settings.
- Sensitivity Label Activities: Applied Sensitivity Label to File, Changed Sensitivity Label to File, Removed Sensitivity Label to File.
- Azure Information Protection Activities; all settings.
- Purview Data Map Activities; all settings.
- Once all the settings are configured, you will also need to supply the search with a Date and Time Range; this search can go back as far as 90 days. Once all the prerequisites are filled, select Search to start the pulling of all the logs from the Purview log database.
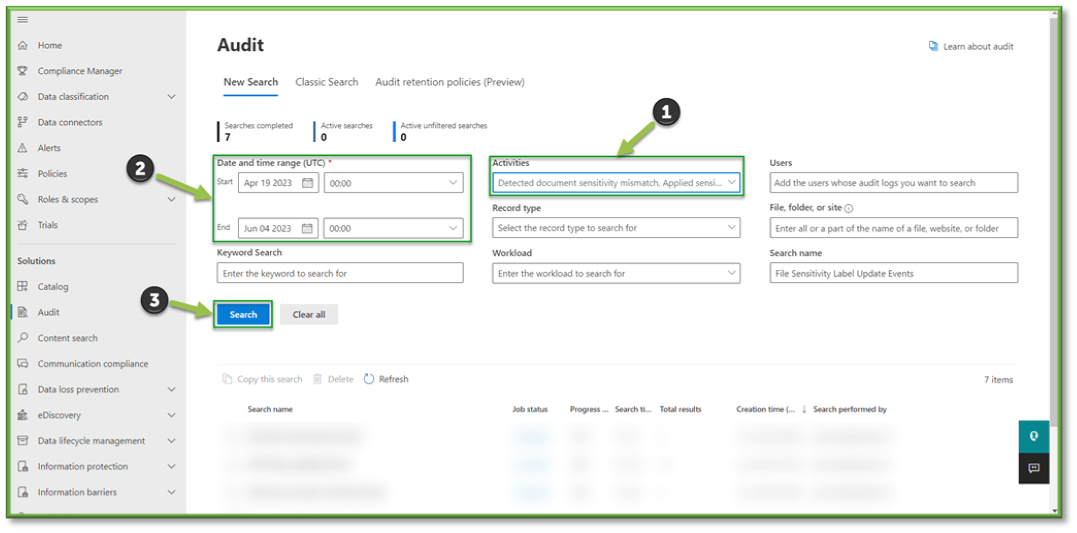
- You will have to wait some time for the queue search to be completed, once it is successfully completed you can select the results. All the events that have taken place between the timeframe specified will be displayed, they will be listed based in descending order of date showing the user that initiated the event, the activity type, the name of the file they accessed and any additional details such as the directory that the file existed in.

Microsoft 365 Defender
- Lastly, we will look at a list of important Defender logs that should be checked:
- Navigate to Auditing – O365 Defender and Reports – O365 Defender these will house all the events listed below.
- In Auditing select the Activities Filter, this list will include some O365 Defender events that can be tracked through Purview.
- For the sake of incident events that can be monitored through O365 Defender the following sections will be listed that will encompass these activities. You can use the search box to highlight these sections for easier configuration.
- Microsoft 365 Defender Incident Activities; all settings.

- Microsoft 365 Defender Incident Activities; all settings.
- Once all the settings are configured, you will also need to supply the search with a Date and Time Range; this search can go back as far as 90 days. Once all the prerequisites are filled, select Search to start the pulling of all the logs from the Purview log database.
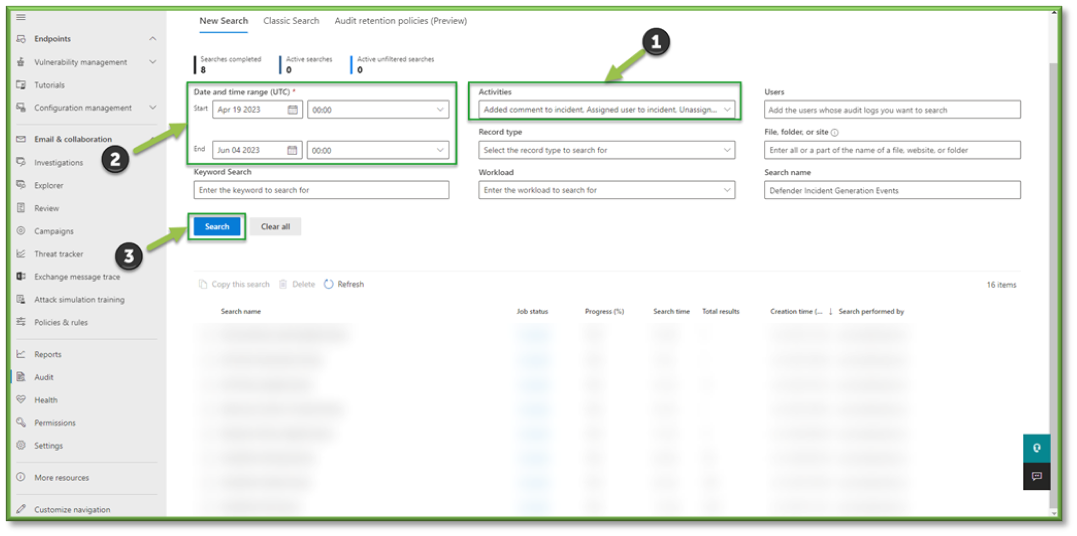
- You will have to wait some time for the queue search to be completed, once it is successfully completed you can select the results. All the events that have taken place between the timeframe specified will be displayed, they will be listed based in descending order of date showing the user that initiated the event, the activity type, the name of the file they accessed and any additional details such as the directory that the file existed in.
- From the Reports section, select Threat Protection this will list all the alerts generated from your organization.
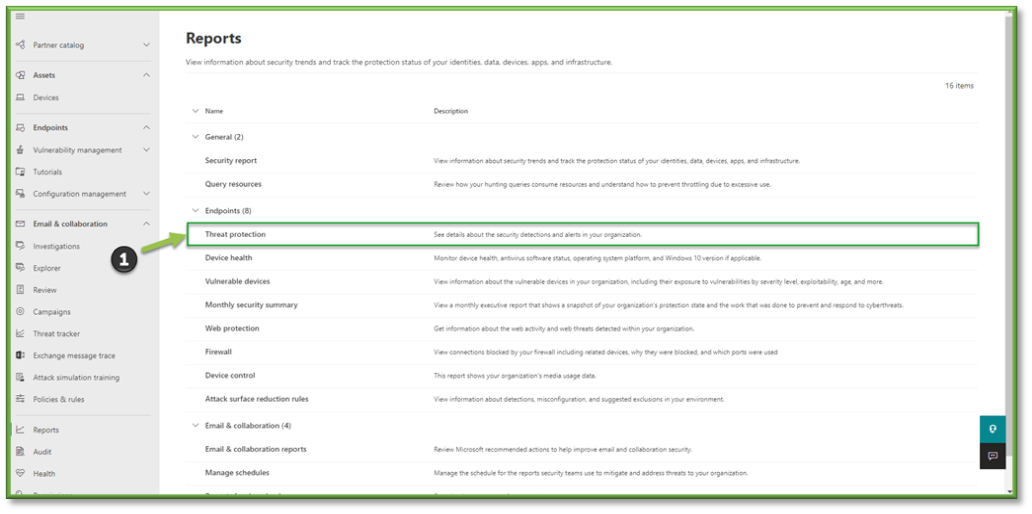
- A redirect will occur that will display the trend of alerts generation events; breaking it down into the types of alerts generated by different security controls, as well as a timeline of when they occurred and a quantity association; this can be useful in determining the types of threats that type to exploit your organization and show indicators of efforts needing to be high in protecting those vectors.
- Additional information related to the status of alerts that haven’t been resolved that exist currently in your organization will also be listed; categorizing the types of threats that were generated by the alert, what security controls were used to detect these threats, as well as the severity level of the threats that exist. This information can be useful in determining risk for the organization as well as give indicators to administration on possible remediation items that need to be prioritized to mitigate the risk associated with these vectors.
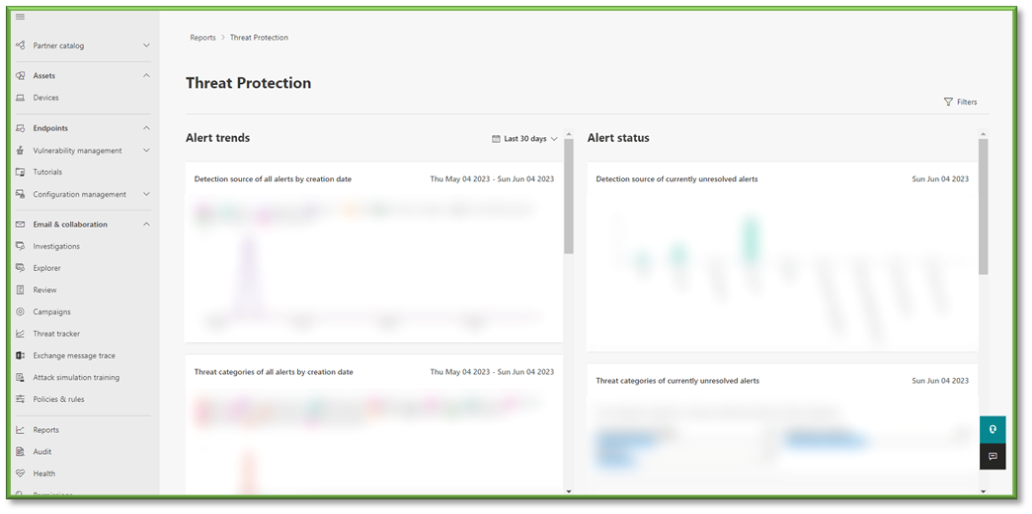
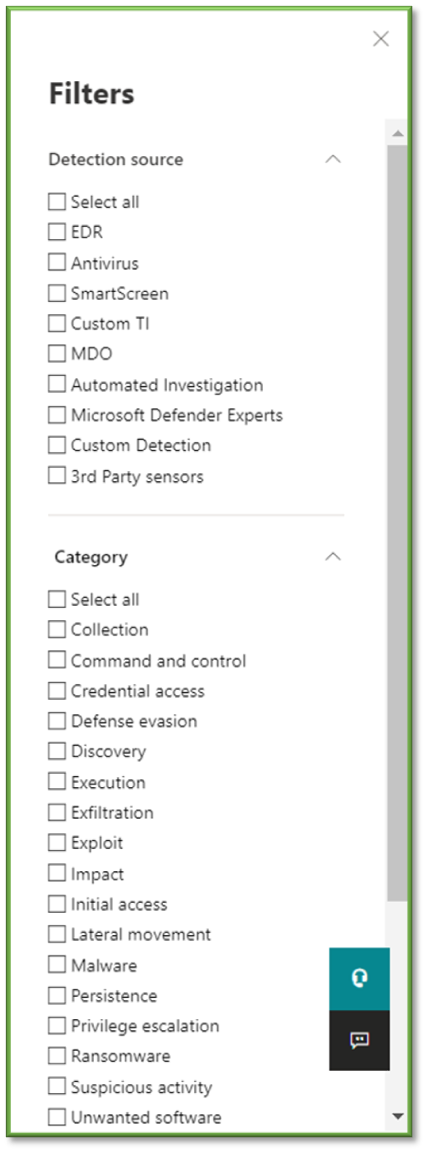
- Lastly you can select Filters to specify a wide variety of options to help narrow down the scope of alert generation. Detection Source revolves around the type of security control that was used gather the information for the threat detected as well as generated the alert for administration. Category revolves around the type of threats that currently exist. Severity ties to the severity level of the alert generated based off the threat detected. Classification deals with the status of the alert being true, false, or informational.
- In Auditing select the Activities Filter, this list will include some O365 Defender events that can be tracked through Purview.
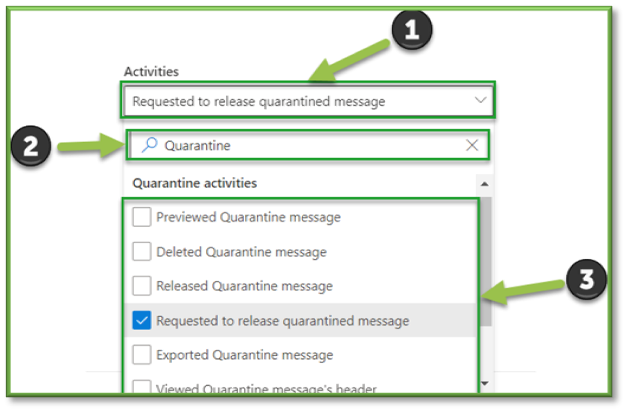
- For the sake of quarantine message alert generation events that can be monitored through O365 Defender the following sections will be listed that will encompass these activities. You can use the search box to highlight these sections for easier configuration.
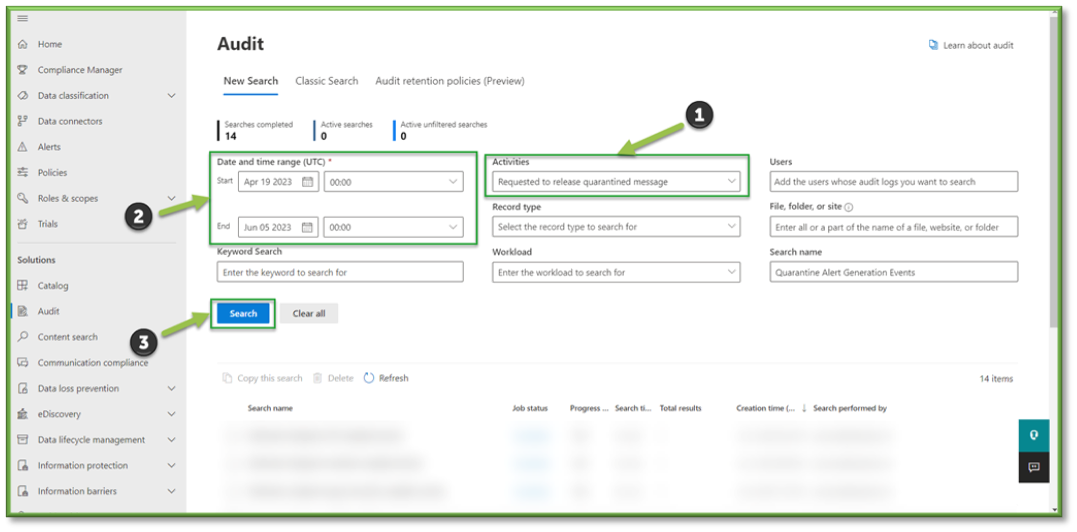
- Quarantine Activities: Request to Release Quarantined Message.
- Quarantine Activities: Request to Release Quarantined Message.
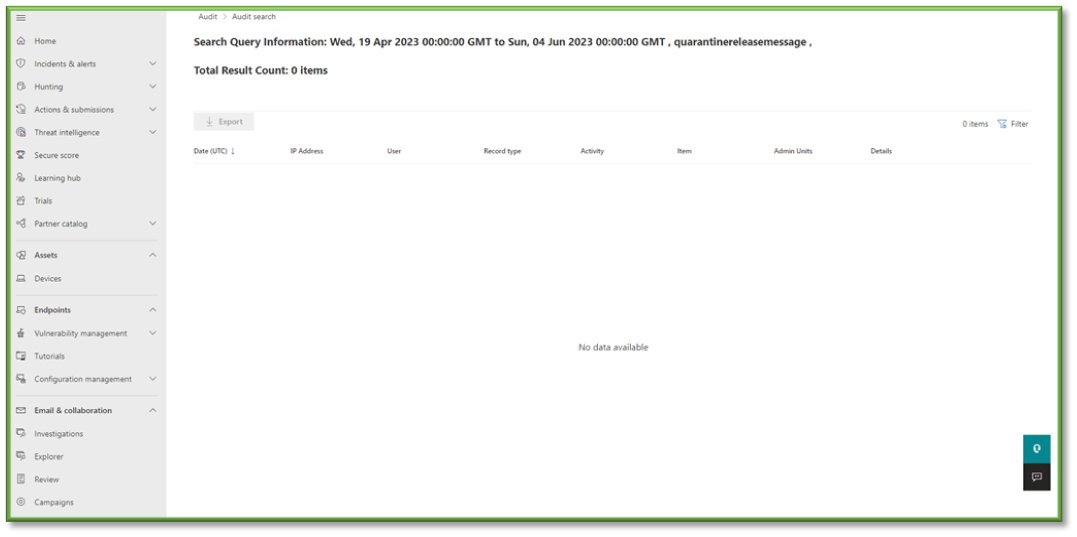
- Once all the settings are configured, you will also need to supply the search with a Date and Time Range; this search can go back as far as 90 days. Once all the prerequisites are filled, select Search to start the pulling of all the logs from the Purview log database.
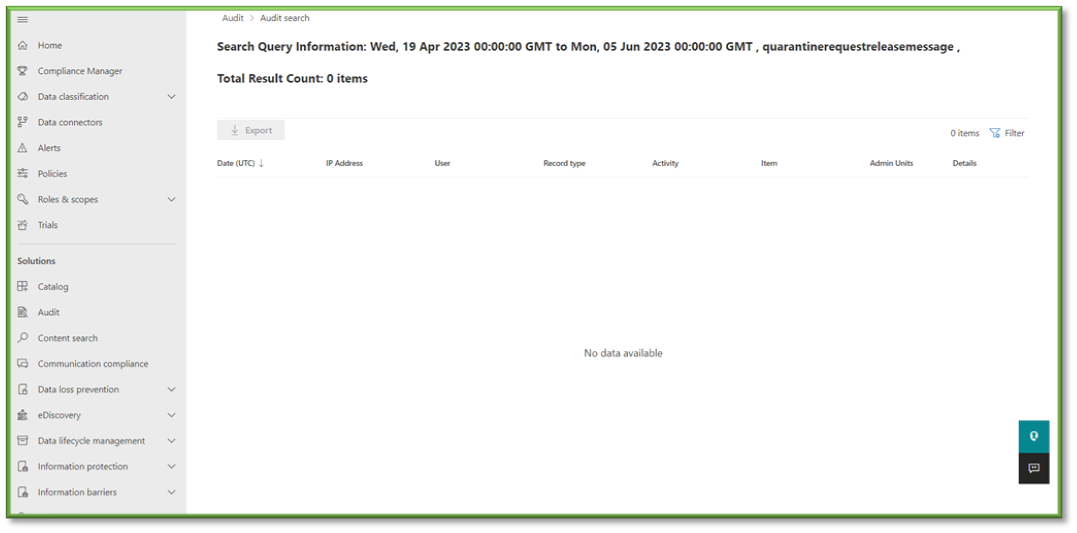
- You will have to wait some time for the queue search to be completed, once it is successfully completed you can select the results. All the events that have taken place between the timeframe specified will be displayed, they will be listed based in descending order of date showing the user that initiated the event, the activity type, the name of the file they accessed and any additional details such as the directory that the file existed in.
- In Auditing select the Activities Filter, this list will include some O365 Defender events that can be tracked through Purview.
- For the sake of quarantine message viewing events that can be monitored through O365 Defender the following sections will be listed that will encompass these activities. You can use the search box to highlight these sections for easier configuration.
- Quarantine Activities: Previewed Quarantine Message, Exported Quarantine Message, Viewed Quarantine Message Headers.
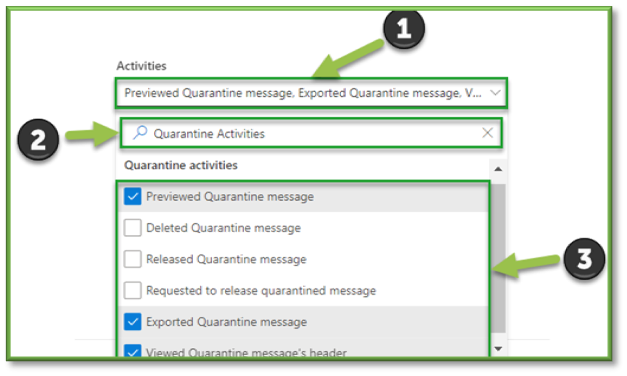
- Quarantine Activities: Previewed Quarantine Message, Exported Quarantine Message, Viewed Quarantine Message Headers.
- Once all the settings are configured, you will also need to supply the search with a Date and Time Range; this search can go back as far as 90 days. Once all the prerequisites are filled, select Search to start the pulling of all the logs from the Purview log database.
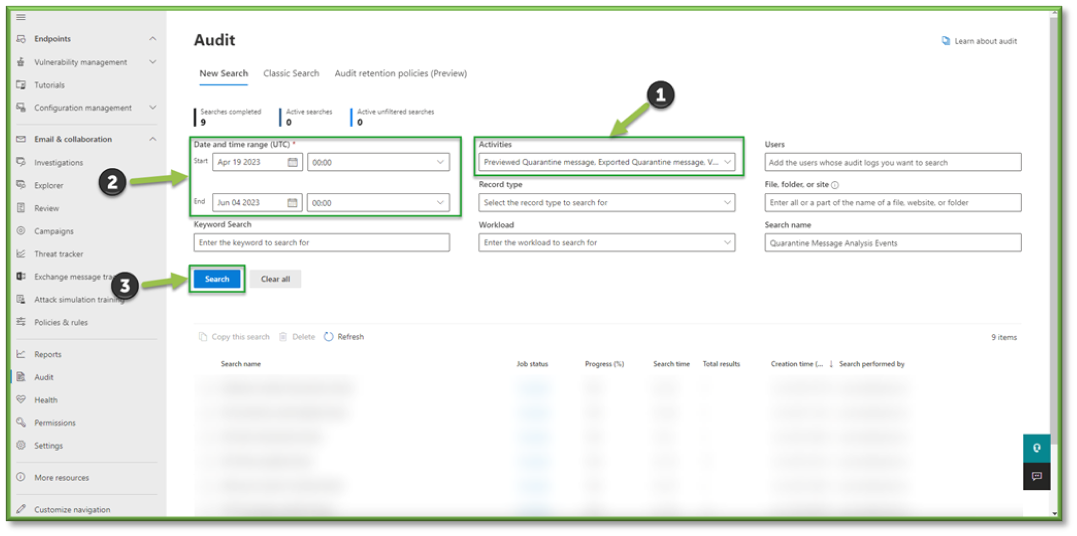
- You will have to wait some time for the queue search to be completed, once it is successfully completed you can select the results. All the events that have taken place between the timeframe specified will be displayed, they will be listed based in descending order of date showing the user that initiated the event, the activity type, the name of the file they accessed and any additional details such as the directory that the file existed in.

- In Auditing select the Activities Filter, this list will include some O365 Defender events that can be tracked through Purview.
- For the sake of quarantine message release events that can be monitored through O365 Defender the following sections will be listed that will encompass these activities. You can use the search box to highlight these sections for easier configuration.
- Quarantine Activities: Released Quarantine Message.
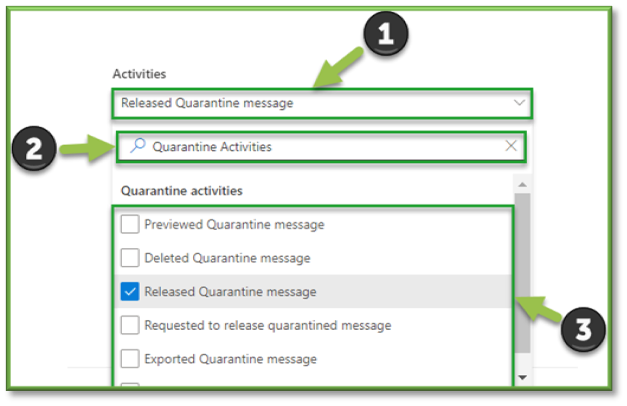
- Quarantine Activities: Released Quarantine Message.
- Once all the settings are configured, you will also need to supply the search with a Date and Time Range; this search can go back as far as 90 days. Once all the prerequisites are filled, select Search to start the pulling of all the logs from the Purview log database.
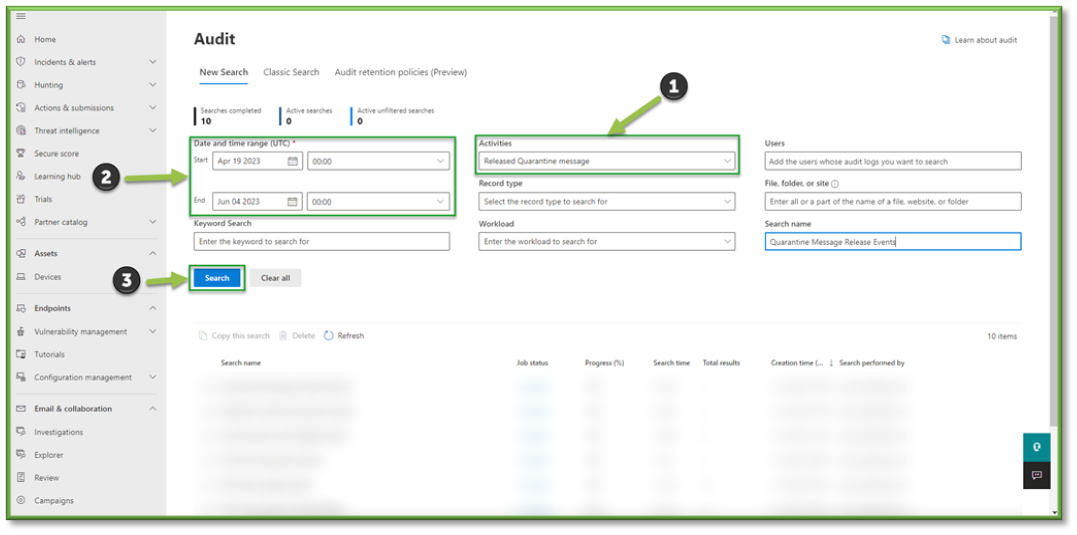
- You will have to wait some time for the queue search to be completed, once it is successfully completed you can select the results. All the events that have taken place between the timeframe specified will be displayed, they will be listed based in descending order of date showing the user that initiated the event, the activity type, the name of the file they accessed and any additional details such as the directory that the file existed in.
- In Auditing select the Activities Filter, this list will include some O365 Defender events that can be tracked through Purview.
- For the sake of Isolation Update events that can be monitored through O365 Defender the following sections will be listed that will encompass these activities. You can use the search box to highlight these sections for easier configuration.
- Encrypted Message Portal Activities: all settings.
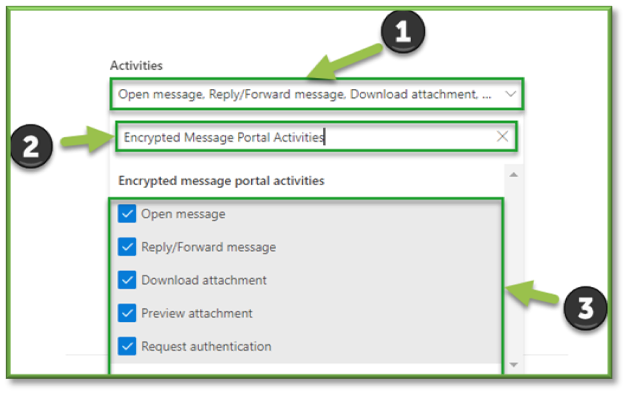
- Encrypted Message Portal Activities: all settings.
- Once all the settings are configured, you will also need to supply the search with a Date and Time Range; this search can go back as far as 90 days. Once all the prerequisites are filled, select Search to start the pulling of all the logs from the Purview log database.

- You will have to wait some time for the queue search to be completed, once it is successfully completed you can select the results. All the events that have taken place between the timeframe specified will be displayed, they will be listed based in descending order of date showing the user that initiated the event, the activity type, the name of the file they accessed and any additional details such as the directory that the file existed in.

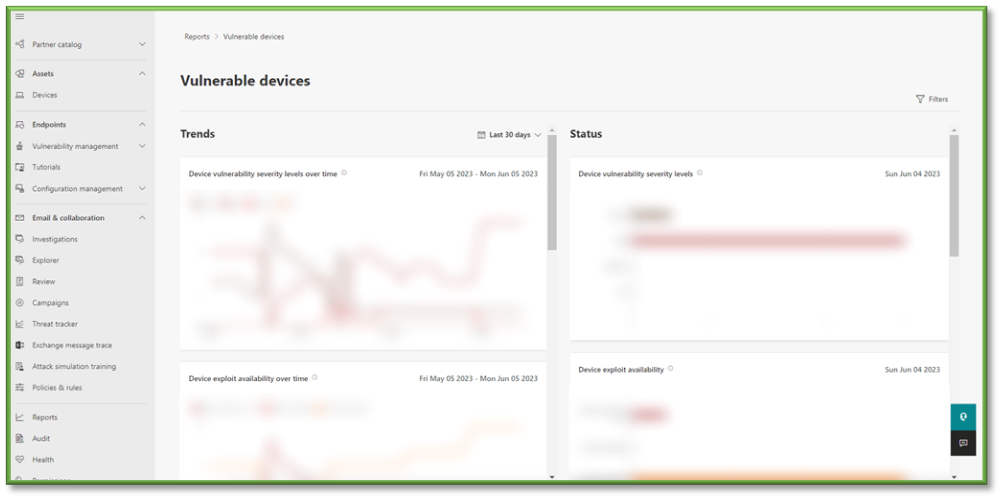
- From the Reports section, select Vulnerable Devices this will list all the alerts related to vulnerabilities generated from your organization.

- A redirect will occur that will display the trend of vulnerability generation events; breaking it down into a timeline of when they occurred and a quantity association as well as determining the operating system that these vulnerabilities have been impacting the most; this can be useful in determining the types of threats that type to exploit your organization and show indicators of efforts needing to be high in protecting those vectors.
- Additional information related to the status of vulnerabilities that haven’t been resolved that exist currently in your organization will also be listed; severity level of the vulnerabilities that exist, the ease of exploitation on the machine, as well as operating system details. This information can be useful in determining risk for the organization as well as give indicators to administration on possible remediation items that need to be prioritized to mitigate the risk associated with these vectors.
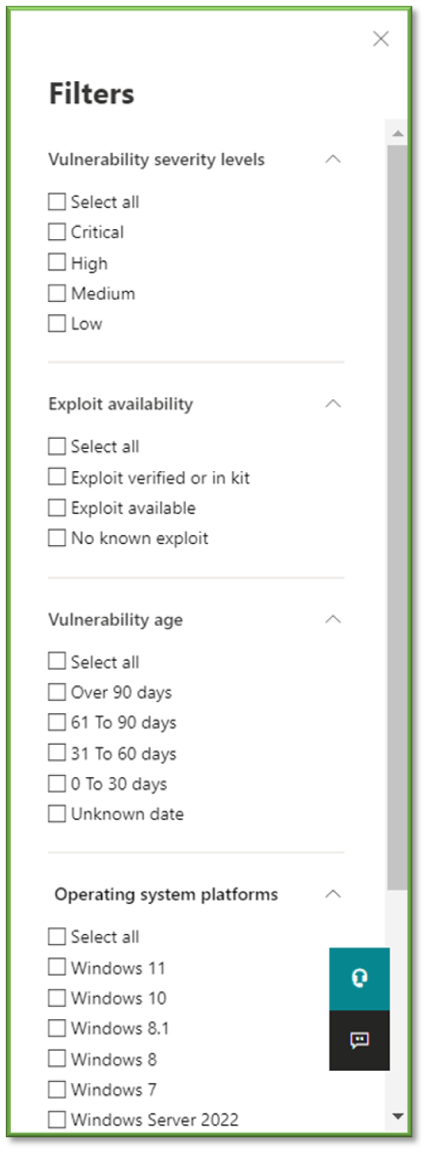
- Lastly you can select Filters to specify a wide variety of options to help narrow down the scope of alert generation. Vulnerabilities Severity Levels ties to the severity level of the vulnerability generated based off the exploit detected. Exploit Availability details how easy an exploit can be leverage on a device. Vulnerability Age specifies the longevity of the vulnerability detection being registered for the device. Operating System Platforms details the operating system that this vulnerability has been found on. Windows 10 & 11 Version specifies the granular operating system version that the exploit currently exist for.
- In Auditing select the Activities Filter, this list will include some O365 Defender events that can be tracked through Purview.
- For the sake of IOC update events that can be monitored through O365 Defender the following sections will be listed that will encompass these activities. You can use the search box to highlight these sections for easier configuration.
- Microsoft Defender for Endpoint Settings Activities: Added Indicator, Edited Indicator, Deleted Indicator.
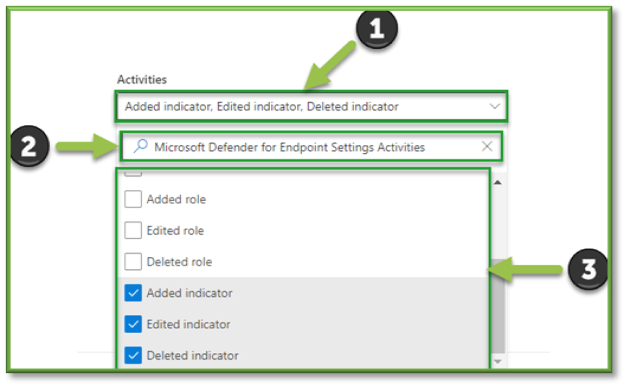
- Microsoft Defender for Endpoint Settings Activities: Added Indicator, Edited Indicator, Deleted Indicator.
- Once all the settings are configured, you will also need to supply the search with a Date and Time Range; this search can go back as far as 90 days. Once all the prerequisites are filled, select Search to start the pulling of all the logs from the Purview log database.
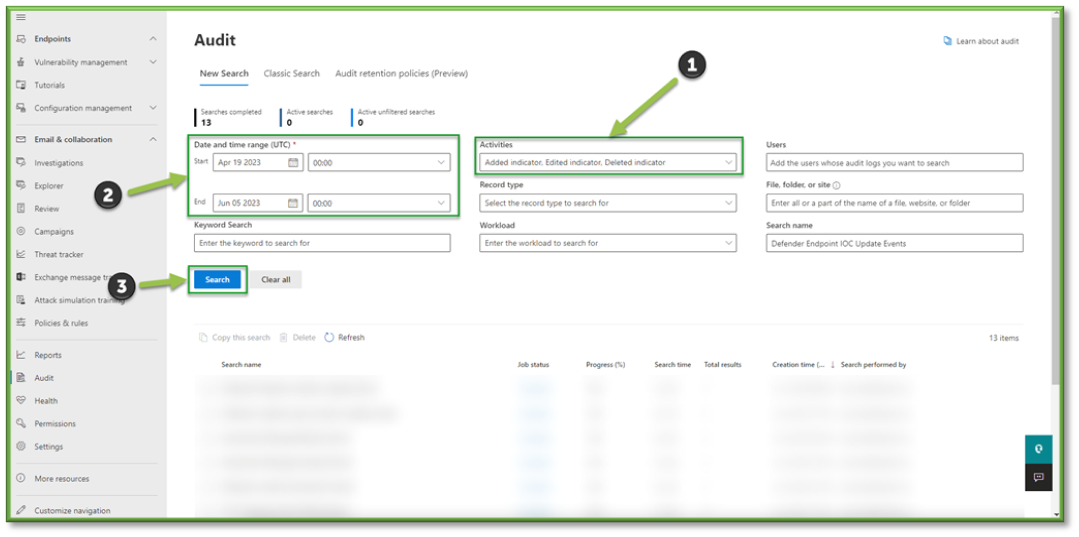
- You will have to wait some time for the queue search to be completed, once it is successfully completed you can select the results. All the events that have taken place between the timeframe specified will be displayed, they will be listed based in descending order of date showing the user that initiated the event, the activity type, the name of the file they accessed and any additional details such as the directory that the file existed in.

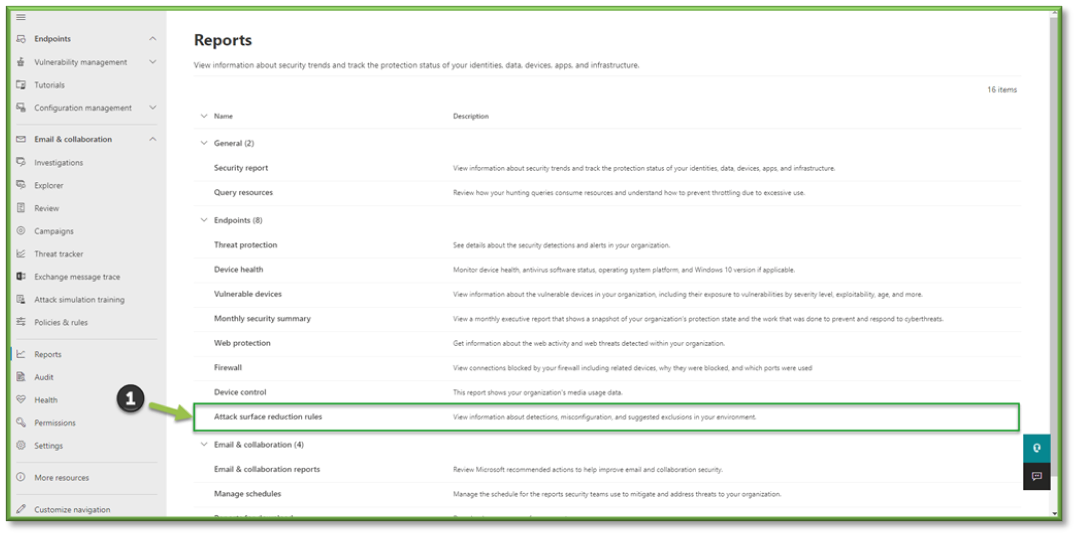
- From the Reports section, select Attack Surface Reduction Rules this will list all the alerts related to Attack Surface Reduction Rule enforcement generated from your organization.
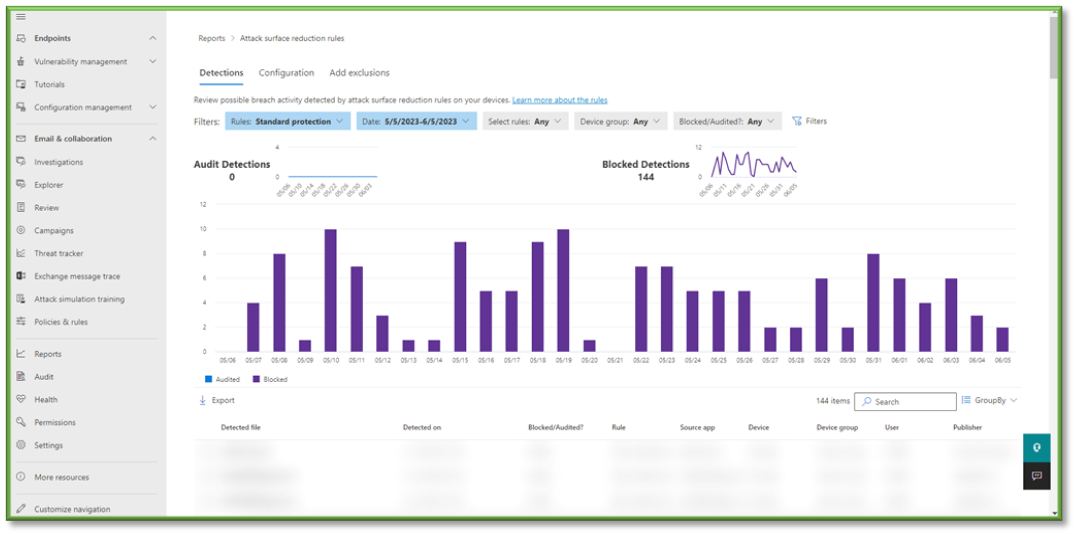
- A redirect will occur that will display the trend of ASR block events; breaking it down into a timeline of when they occurred and a quantity association. A list of all the ASR block events will be listed including details such as the file that was blocked, the rule that was applied to capture the file, which device it was pulled from, and the association of the Publisher and the file.

- Lastly you can select Filters to specify a wide variety of options to help narrow down the scope of alert generation. Rules specifies the type of ASR rule that is being applied for the block or auditing process, this can be scope to either standard rules or all rules. Date allows you to determine the timeline for the log pull, you can specify a window of up to 90 days. Select Rules allows you to specify the security configuration type that was associated with the block that was placed on the file. Device Group allows you to select a preconfigured group of associated devices that have been registered through active directory. Blocked/Audited? Allows you to check specifically for either ASR audits for files or blocks for files.
- In Auditing select the Activities Filter, this list will include some O365 Defender events that can be tracked through Purview.
- For the sake of Isolation Update events that can be monitored through O365 Defender the following sections will be listed that will encompass these activities. You can use the search box to highlight these sections for easier configuration.
- Microsoft Defender for Endpoint Response Activities: Isolated Device, Release from Isolation.
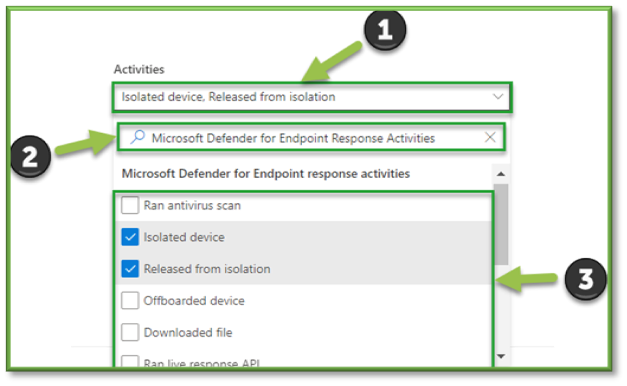
- Microsoft Defender for Endpoint Response Activities: Isolated Device, Release from Isolation.
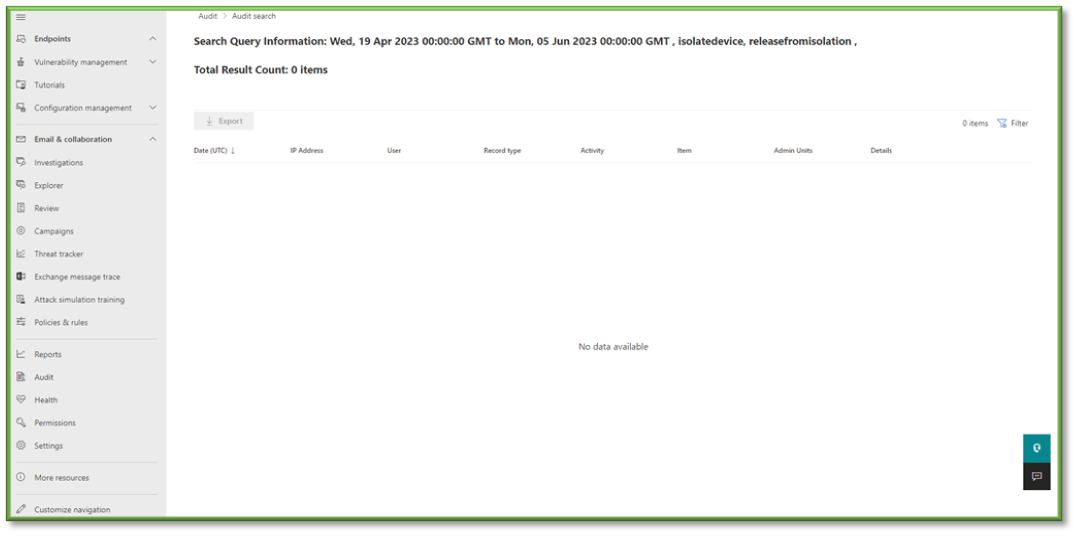
- Once all the settings are configured, you will also need to supply the search with a Date and Time Range; this search can go back as far as 90 days. Once all the prerequisites are filled, select Search to start the pulling of all the logs from the Purview log database.
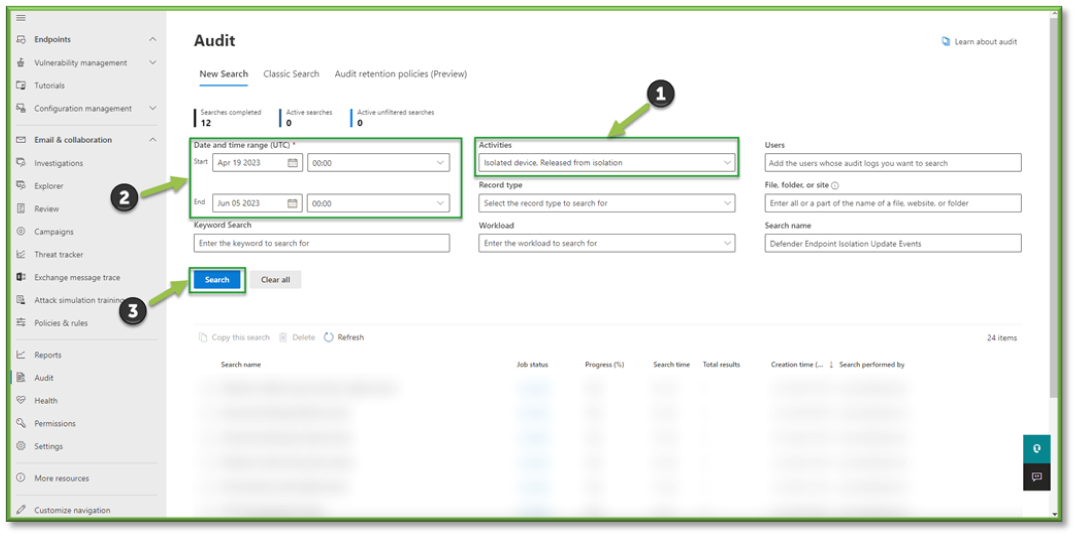
- You will have to wait some time for the queue search to be completed, once it is successfully completed you can select the results. All the events that have taken place between the timeframe specified will be displayed, they will be listed based in descending order of date showing the user that initiated the event, the activity type, the name of the file they accessed and any additional details such as the directory that the file existed in.
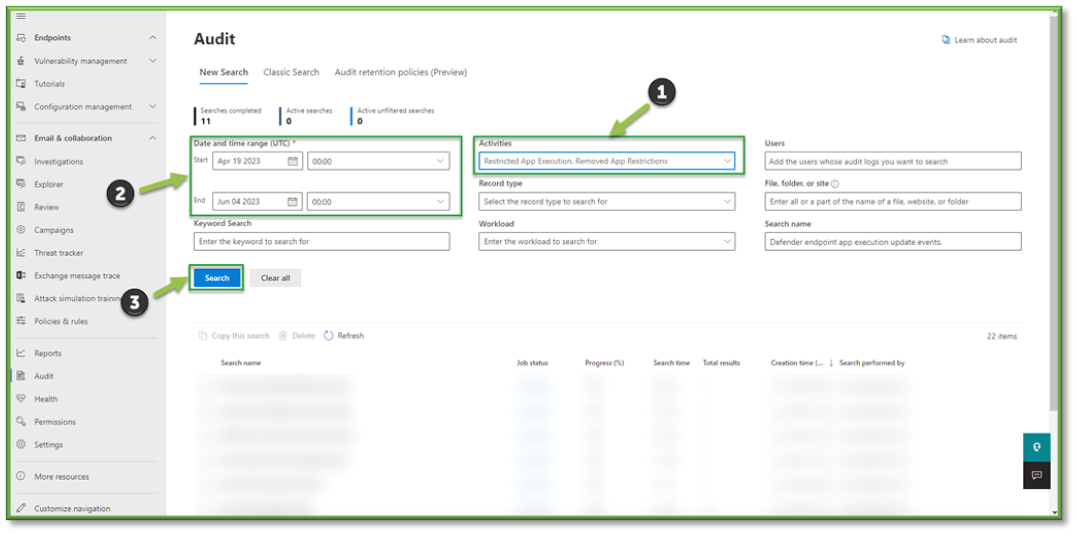
- In Auditing select the Activities Filter, this list will include some O365 Defender events that can be tracked through Purview.
- For the sake of Endpoint App Execution Update events that can be monitored through O365 Defender the following sections will be listed that will encompass these activities. You can use the search box to highlight these sections for easier configuration.
- Microsoft Defender for Endpoint Response Activities: Restricted App Execution, Removed App Restrictions.
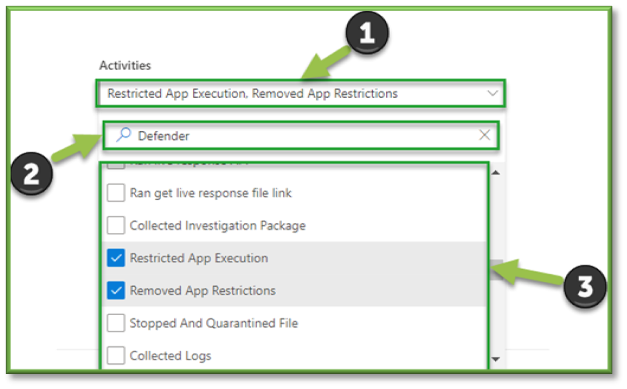
- Microsoft Defender for Endpoint Response Activities: Restricted App Execution, Removed App Restrictions.
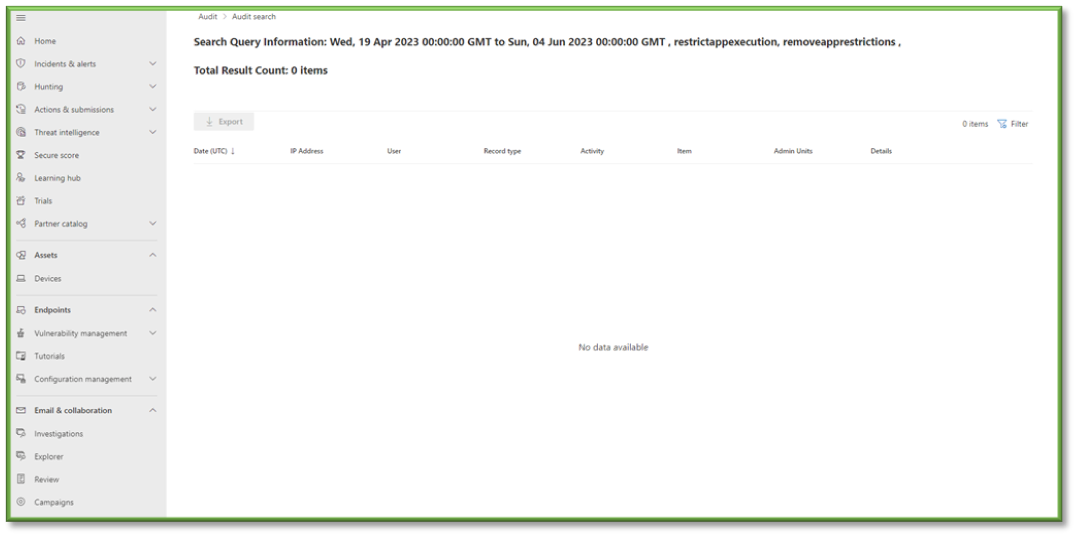
- Once all the settings are configured, you will also need to supply the search with a Date and Time Range; this search can go back as far as 90 days. Once all the prerequisites are filled, select Search to start the pulling of all the logs from the Purview log database.
- You will have to wait some time for the queue search to be completed, once it is successfully completed you can select the results. All the events that have taken place between the timeframe specified will be displayed, they will be listed based in descending order of date showing the user that initiated the event, the activity type, the name of the file they accessed and any additional details such as the directory that the file existed in.
You're Finished!
You should have successfully viewed and collected the necessary data in relation to the audit logs outlined in their respective portals. For any other problems or questions, reach out to us!